If you want to avoid losing your capital, then you need to understand and recognize volume indicators. When everyone is focused on price action and trying to enter trades with technical analysis, you can also focus on trading volumes and see what everyone else doesn’t see. Trading volume indicators are like power plants that confirm trends, reveal reversals, and reveal the strength (or weakness) behind every market move.
Surely by now your interest and attention has been attracted to this phenomenon and you want to know more about this hidden secret in the heart of the market. In the rest of this article, we are going to get acquainted with the most powerful volume indicators, how they work, and how to use them to achieve a great and low-risk strategy.
To make good profits in the world’s most reputable financial markets like Forex, you need to know where the big traders enter trades. No matter what type of trader you are (day trader, swing trader or long-term investor), knowing trading volumes can guide you in making important decisions, and by mastering volume analysis, you can significantly improve your decision-making. So stay tuned!
Why Volume Matters in Trading?
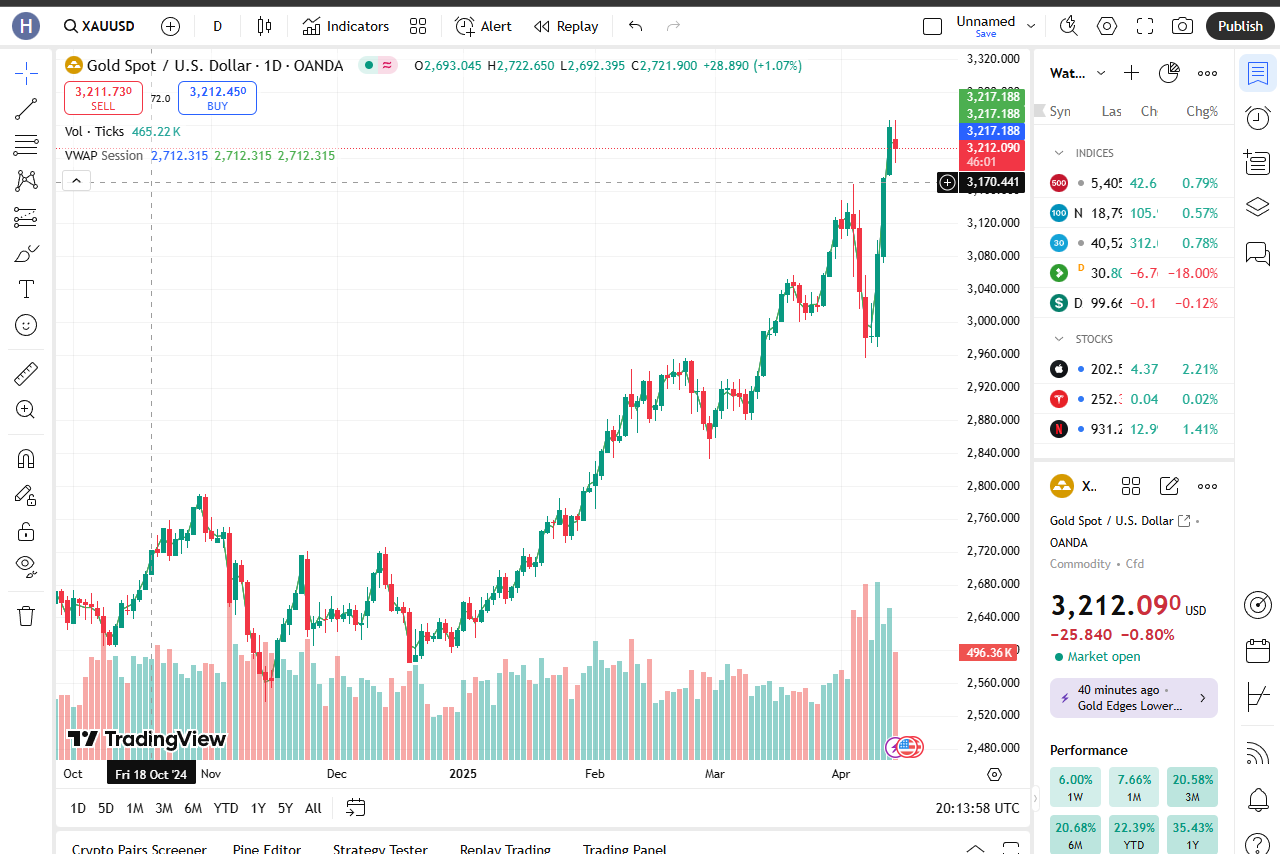
Let’s first look at what volume is. Volume is the number of shares or contracts traded in a security or market over a given period. If we say volume is high, it means that traders are interested in entering a trade and there are a lot of trades in that area, while when we say volume is low in an area, it means that most people are indifferent to price changes and do not want to trade at the moment. In other words, price tells you what happened, but volume tells you how it happened.
If a stock is rising on low volume, the move may not be convincing. But if it is falling on high volume, institutional money is likely fueling the rally. If you thought indicators were useless, you are sorely mistaken. Volume indicators do not tell you where to trade, but they do give you accurate market clues that can help a lot.
Using volume indicators, you can confirm trends. Wherever you see a price increase with a simultaneous increase in volume, it means a strong trend is occurring. Also, divergence between price and volume can indicate exhaustion. Big players leave footprints in volume data, and you can identify them using these indicators. Now let’s get acquainted with the best and most effective volume indicators and how to use them with examples.
1.On-Balance Volume (OBV): Tracking Money Flow
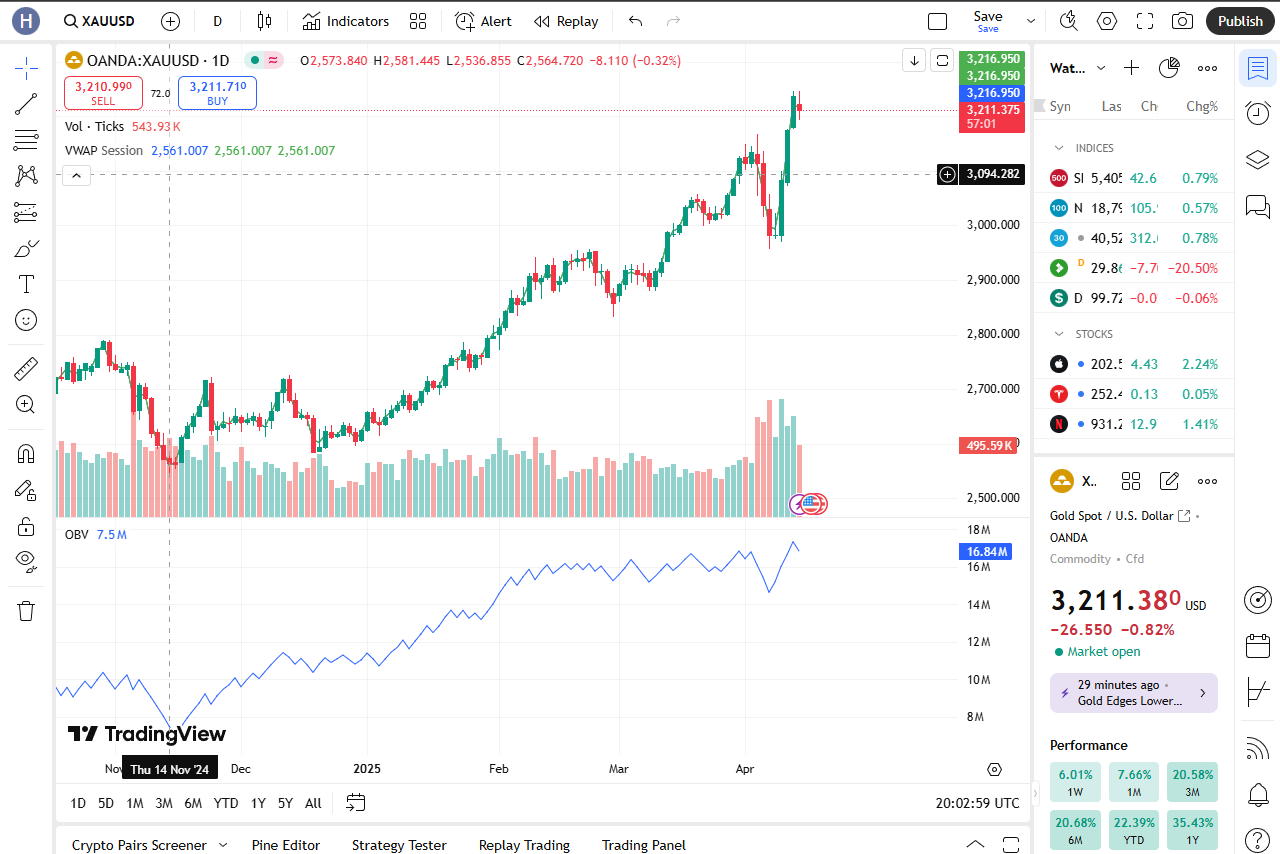
Developed by Joseph Granville in the 1960s, OBV is one of the simplest yet most powerful volume indicators ever to hit the market. The general idea behind this indicator is that it measures buying and selling pressure by adding or subtracting volume based on price action. When today’s closing price is higher than yesterday’s, it adds today’s volume to OBV. If today’s closing price is lower, it subtracts today’s volume. The cumulative total forms the OBV line, which moves with the trend.
How Traders Use OBV + Example
Trend Confirmation: If price and OBV are rising together, the uptrend is strong.
Divergence Signals: If price hits a high but OBV doesn’t, it could mean the momentum is weakening.
Breakout Validation: A breakout is more likely to continue as the OBV rises.
Now let`s see an example for this: If a stock is in an uptrend but the OBV starts to decline, the smart money may be exiting – a warning sign before a reversal.
2.Volume Weighted Average Price (VWAP): Institutional Benchmark
Another important indicator that is popular among institutional traders and trading systems is VWAP (Volume Weighted Average Price). This indicator calculates the average price at which a security has traded during the day and weights it by volume, which is a great help to traders.
Large institutions use VWAP to execute large orders without moving the market, while day traders use it to assess whether they are buying at a premium or a discount.
Trading Strategies with VWAP
There are several popular strategies that traders use, and you can choose from them based on your personality and psychology and start trading.
Returning Average: Price tends to return to VWAP – buy near VWAP in an uptrend, sell near it in a downtrend.
Confirmation of Breakout: A strong move above VWAP with high volume indicates continuation.
Trend Filter: Price above VWAP = Bullish bias. Below = Bearish
One thing we can point out is that if you want to use this indicator like the pros, combine VWAP with moving averages for stronger confirmation.
3.Accumulation/Distribution Line (A/D): Spotting Smart Money Moves
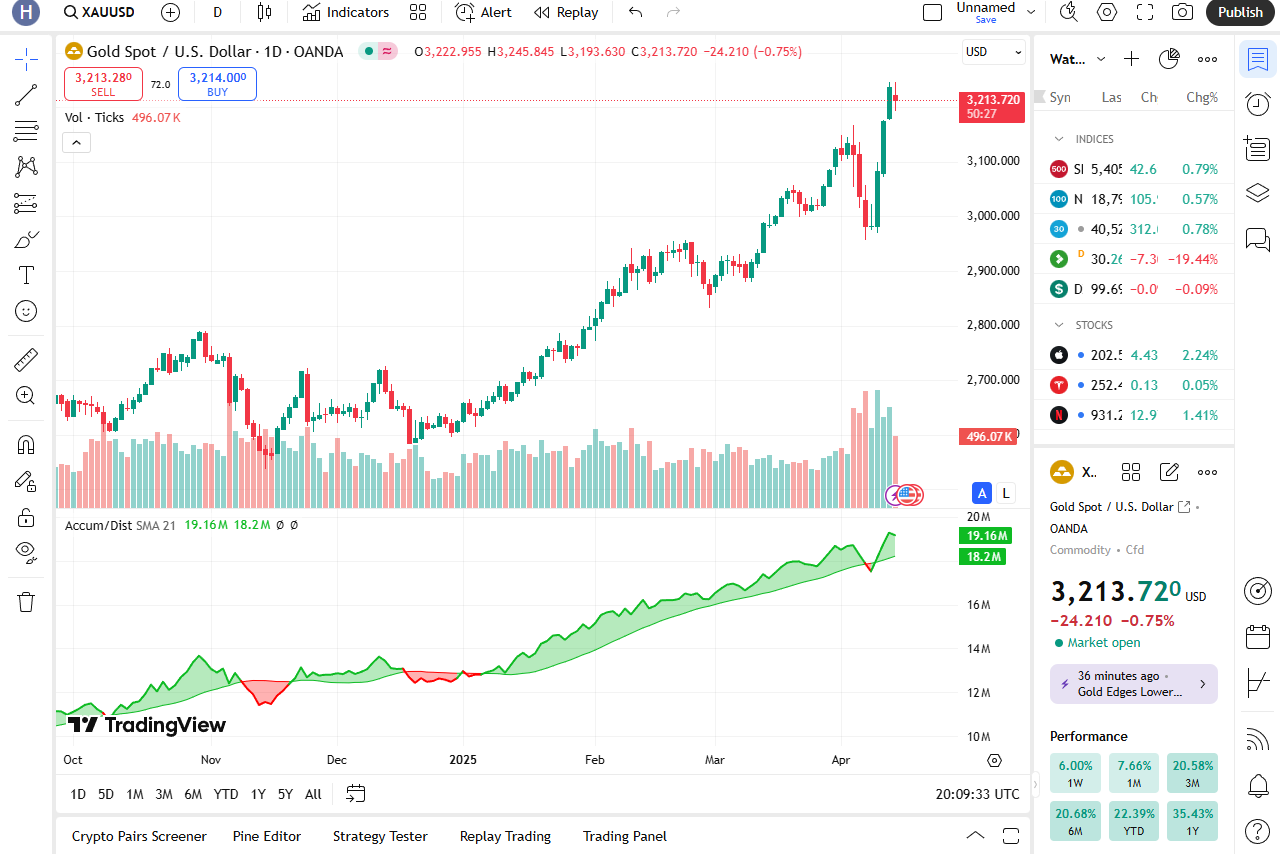
Some new to the market may not be able to distinguish between accumulation and distribution of trades on the chart. In general, the accumulation/distribution (A/D) line helps to identify whether a stock is being accumulated (bought) or distributed (sold) by large players. You can use it to form an overall view of the market. Now let’s see how this indicator works?
If the closing price is in the upper half of the daily range, most of the volume is considered accumulation, and if it is in the lower half, the volume is considered distribution.
Some of the uses of this indicator include confirming trend strength, divergence trading, and breakout validation.
Trend strength: A rising A/D line confirms an uptrend, and a falling one confirms a downtrend.
Divergence trading: If the price is rising but the A/D is falling, institutions may be selling.
Breakout validation: A breakout with a rising A/D line has a higher chance of success.
A practical example of this indicator: If Bitcoin hits an all-time high but the A/D is flat, retail traders may be pushing the price up while institutions stay on the sidelines.
4.Chaikin Money Flow (CMF): Combining Price and Volume
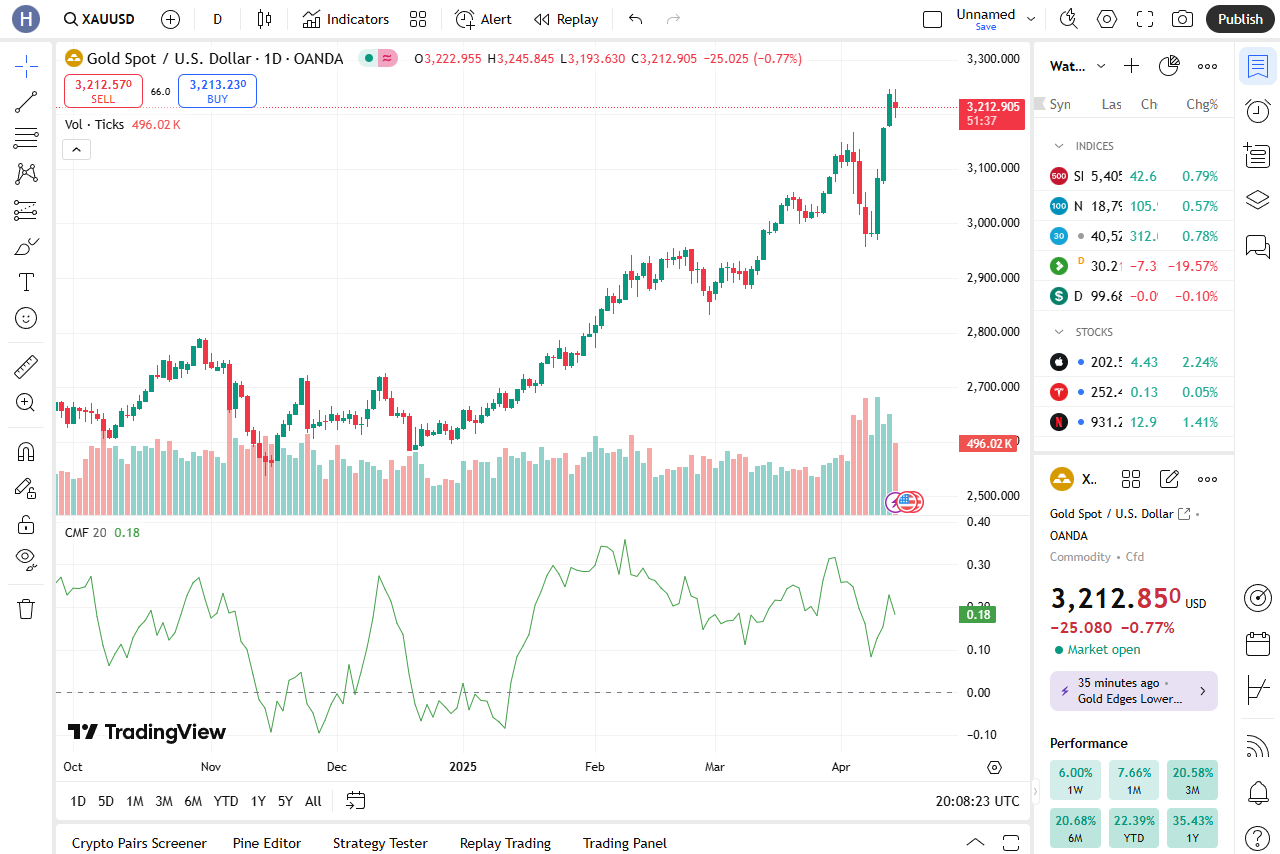
The Chaikin Money Flow Oscillator (CMF) was created by Marc Chaikin and measures buying and selling pressure over a given period (usually 20 or 21 days). This indicator has been used by many YouTubers in recent years, and some have built their own strategies around it.
How CMF Works?
This indicator uses the Money Flow Multiplier, which compares the closing price to the upper and lower ranges. A positive CMF indicates more buying pressure, and a negative CMF indicates more selling pressure.
To use the CMF indicator effectively, you need to follow these steps step by step.
Trend Confirmation: CMF above zero = bullish. Below zero = bearish
Overbought/Oversold: Strong CMF readings can be a reversal signal.
Divergence Signals: Price increase + CMF decrease = potential reversal.
For example, if Nvidia stock rises but CMF becomes negative, it may be a fakeout.
5.Volume Profile: Seeing Where Volume Concentrates
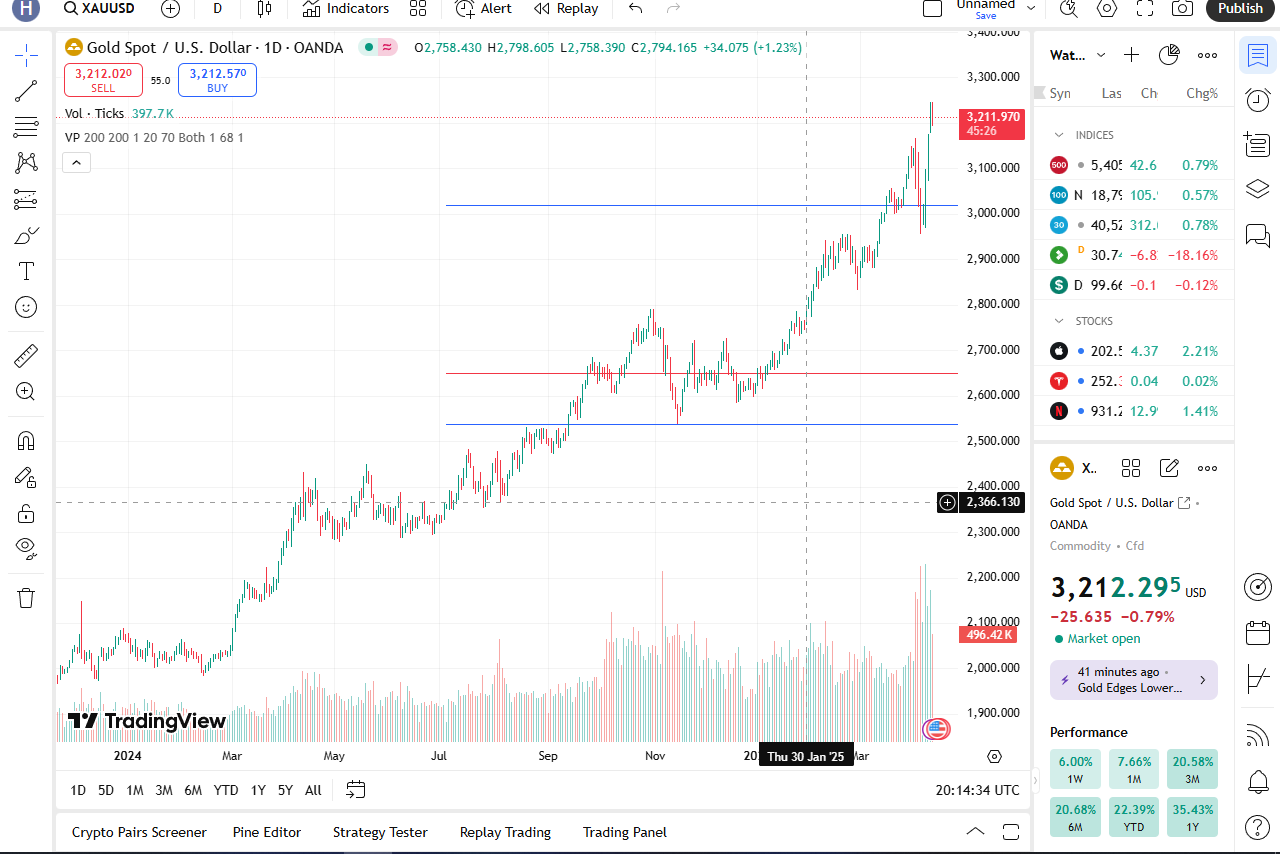
Unlike traditional indicators, Volume Profile displays volume at specific price levels rather than over time, which is its biggest advantage over other indicators. It shows key support/resistance areas based on trading activity.
There are two key Volume Profile concepts You Need to Know to Use It Properly:
- Point of Control (POC): The price level with the highest trading volume.
- Value Zone: The area where 70% of the volume has been processed. It acts as a support/resistance zone.
How Traders Use Volume Profile + Example
Breakout Trades: A break above the value zone indicates continuation.
Mean Reversion: Price often returns to the POC before moving.
Institutional Levels: High-volume nodes indicate areas of activity by large players.
Example: If SPY’s POC is $450, expect a strong reaction at that level.
Conclusion
Volume indicators are like X-ray vision for the markets – they show what is happening below the surface (you can see what is happening behind the scenes using them), while price tells the story, volume confirms whether that story is valid or not. So technical analysis alone cannot confirm our entry into a trade and we should use volume indicators to get final confirmations for entry to minimize our risk.
A summary of the uses of the indicators that we have described in this article is as follows:
- OBV tracks the accumulation of buying/selling pressure.
- VWAP helps identify organizational activity.
- A/D Line shows accumulation versus distribution.
- CMF combines price and volume for momentum insights.
- Volume index highlights key trading areas.
By integrating technical analysis and volume into your strategy, you will trade with more confidence, avoid false breakouts, and align yourself with the smart money.
Ready to put volume to work? Start by testing these indicators on your charts—you’ll be amazed at the hidden signals they reveal.
Did you find this guide helpful? Share it with fellow traders and drop a comment below with your favorite volume indicator! 🚀