Weekly charts are one of the best options for traders to capture swings, known as swing trading. Traders who aim for long-term investment find weekly charts particularly useful as they provide a broader perspective of the market. These charts help traders identify trends, key support and resistance levels, and entry and exit points more easily. In this context, we will explore the best indicators for weekly charts and explain how to use and optimize trading strategies for better results. Stay tuned with Roshantrade for more insights.
Why Use Weekly Charts?
- Weekly indicators help you identify long-term trends.
- These indicators assist you in recognizing key support and resistance levels.
- They also help reduce the impact of market noise.
- Traders can make informed decisions for swing trading.
1. Moving Averages (MA)
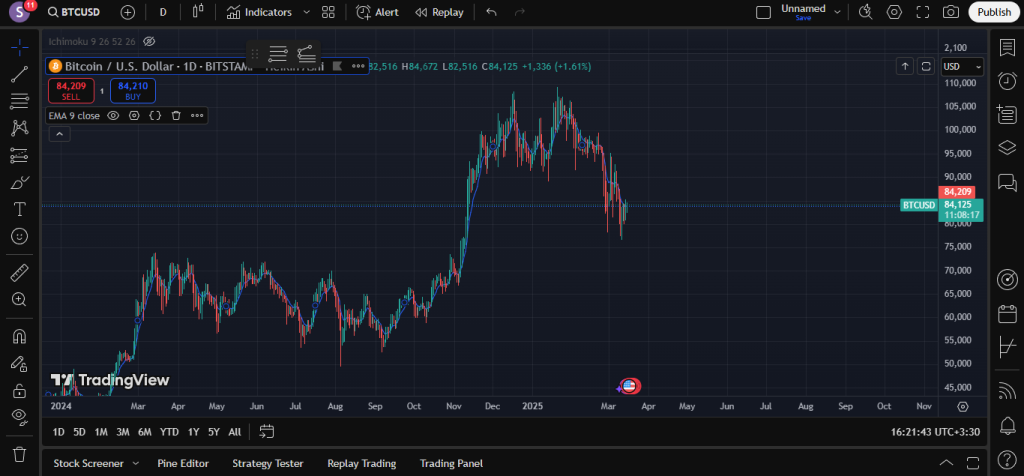
Moving Averages are one of the most popular indicators for weekly charts. With the help of this indicator, you can identify uptrends and downtrends using EMA and SMA. Below, we will explore each of these in detail:
Simple Moving Average (SMA):
The SMA calculates the average price over a specific period. For weekly charts, the 50-week SMA or 200-week SMA is commonly used to identify long-term trends.
Exponential Moving Average (EMA):
The EMA gives more weight to recent prices, making it more responsive to price changes. Typically, the 20-week EMA is used to identify short-term trends within the broader context.
Pay Attention to Crossovers:
For example, when the 50-week SMA crosses above the 200-week SMA (known as the Golden Cross), it indicates a potential uptrend. You can base your trading strategy on such scenarios.
2. Relative Strength Index (RSI)
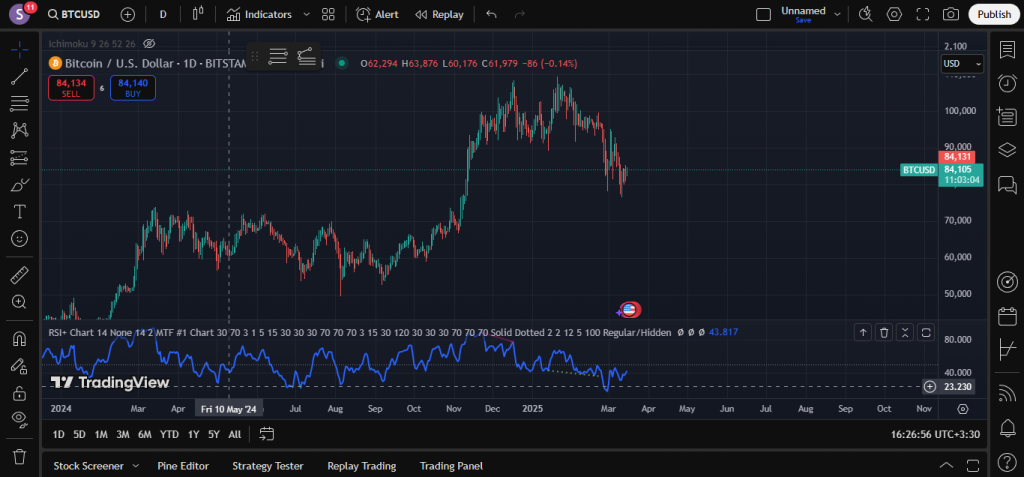
The Relative Strength Index (RSI), a well-known momentum oscillator, measures the speed and change of price movements. This indicator operates within a range of 0 to 100 and is used to identify overbought or oversold conditions.
In weekly charts, an RSI above 70 indicates an overbought condition, while an RSI below 30 suggests an oversold condition.
A divergence between price and RSI can signal a potential trend reversal. This indicator is also considered one of the best indicators for weekly charts, allowing you to develop an effective and practical trading strategy based on its performance and application.
3. Moving Average Convergence Divergence (MACD)
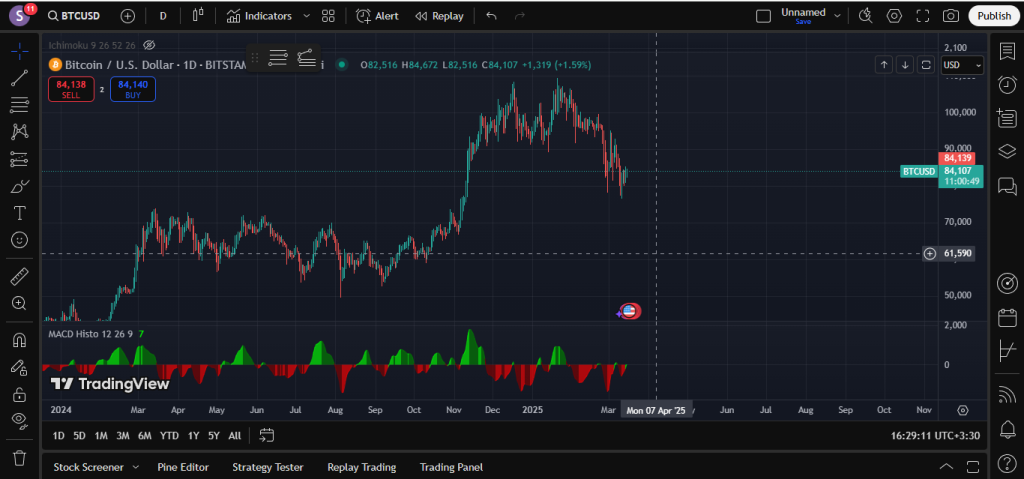
The Moving Average Convergence Divergence (MACD) is a versatile indicator that combines trend-following and momentum elements. This indicator consists of two lines: the signal line and the histogram.
How to Use:
- A bullish signal is generated when the MACD line crosses above the signal line.
- A bearish signal is generated when the MACD line crosses below the signal line.
The MACD histogram can help identify the strength of the trend. This indicator is also considered one of the best indicators for weekly charts, and it can assist traders in making informed decisions.
4. Bollinger Bands
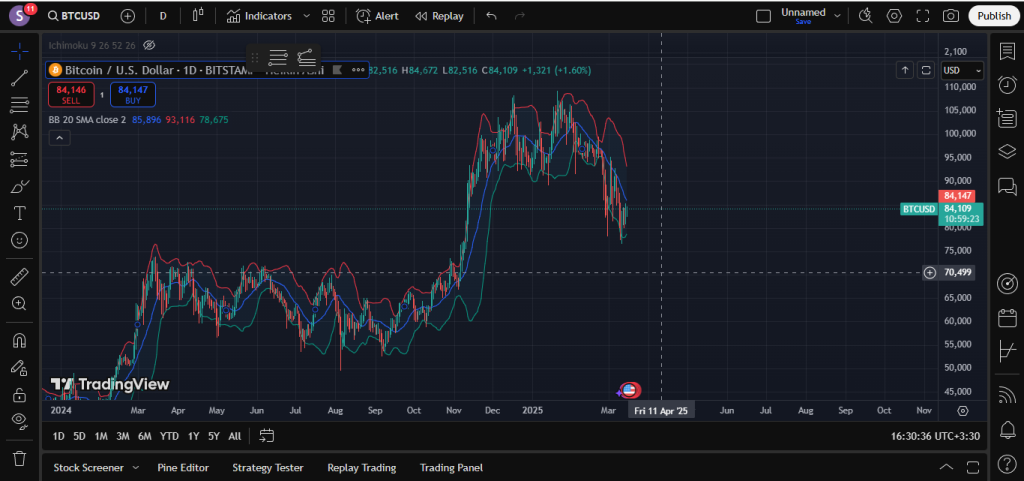
Bollinger Bands consist of a middle SMA line and two outer bands that represent the standard deviation from the mean. This indicator helps identify volatility and potential price reversals. By using this indicator, you can detect potential points for price reversals and execute trades based on them.
How to Use:
- Price touching the upper band may indicate an overbought condition.
- Price touching the lower band may indicate an oversold condition.
- Squeezing of the bands often signals a significant price movement in the near future.
5. Fibonacci Retracement
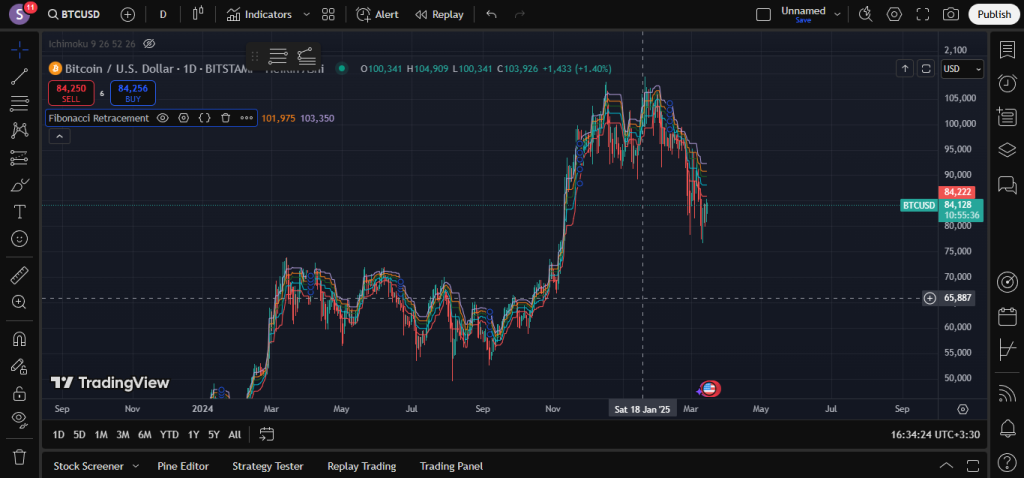
Fibonacci Retracement, a name you’ve likely heard, is one of the best indicators for weekly charts. It consists of horizontal lines that help you identify strong support and resistance levels. This tool is particularly useful in trending markets and can be highly effective for your trading strategy.
How to Use:
- Draw the Fibonacci levels from a significant high to a significant low (or vice versa) on the weekly chart.
- The key levels to watch are 38.2%, 50%, and 61.8%.
6. Volume Indicators
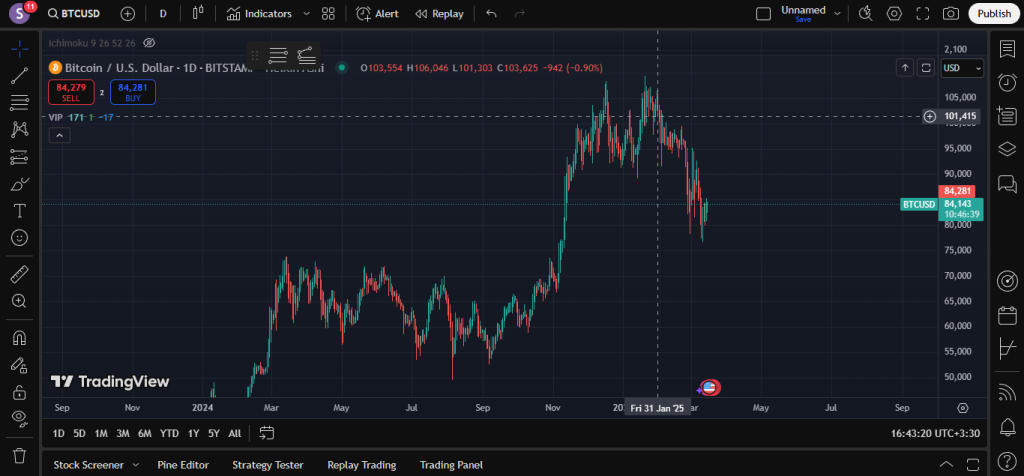
Volume is a critical component of technical analysis. If your strategy is based on technical analysis, this indicator can help you confirm the strength of a trend and identify potential reversal points. It’s worth noting that volume is also one of the best indicators for weekly charts.
How to Use:
- On-Balance Volume (OBV):
- OBV measures buying and selling pressure by adding volume on up days and subtracting volume on down days.
- Rising OBV indicates accumulation (buying pressure), while falling OBV suggests distribution (selling pressure).
- Volume Moving Average:
- A 20-week moving average of volume can help identify periods of increased or decreased interest in an asset.
- A spike in volume often signals a potential trend continuation or reversal, depending on the price action.
7. Ichimoku Cloud
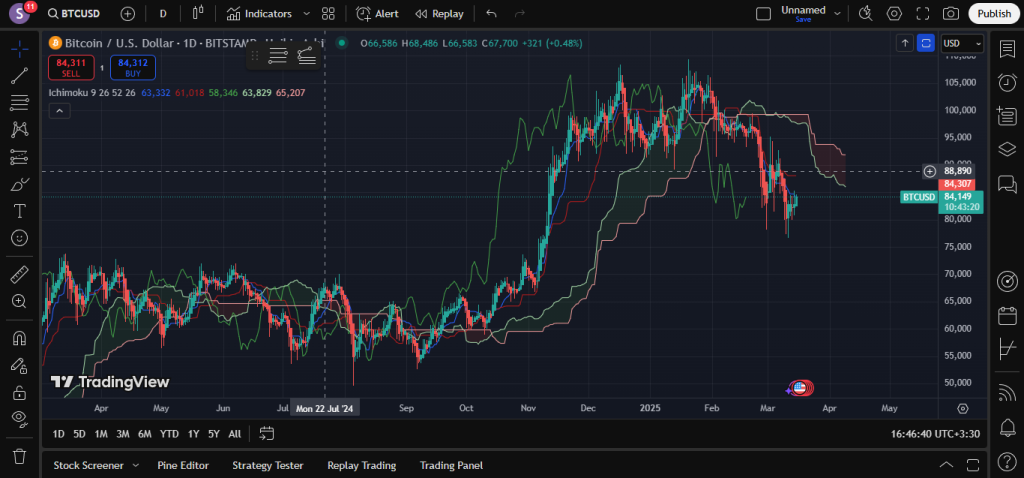
The Ichimoku Cloud is a comprehensive indicator that can function as a standalone strategy. If you master the use of Ichimoku, you can turn it into a complete trading strategy. This indicator provides information about support and resistance, trend direction, trend momentum, and entry and exit points.
How to Use It:
- Price Above the Cloud: Indicates an uptrend.
- Price Below the Cloud: Indicates a downtrend.
- Cloud Thickness: Can signify the strength of support or resistance.
Key Features:
- Trend Identification: The position of the price relative to the cloud helps determine the overall trend.
- Support and Resistance: The cloud itself acts as a dynamic support or resistance zone.
- Momentum: The relationship between the Tenkan-Sen (Conversion Line) and Kijun-Sen (Base Line) can indicate momentum.
- Entry and Exit Points: Crossovers of the Tenkan-Sen and Kijun-Sen, as well as the Chikou Span (Lagging Span), can signal potential entry or exit points.
By understanding and applying these elements, you can develop a robust trading strategy using the Ichimoku Cloud.
Conclusion
Weekly charts are a powerful tool for traders, allowing you to identify long-term trends and make informed decisions. By understanding the best indicators for weekly charts, you can develop a trading strategy that gives you a broad perspective of the market, identify potential reversal points, recognize market trends, and even make long-term investments. These indicators can be used to support your analysis and strategies, but it’s important to limit the number of indicators you use to 2 or 3. Using too many indicators can lead to confusion and misinterpretation of the market.
What do you think is the best indicator?