When Steven W., a young Singaporean with a passion for trading, shared his trading setup on the Forex Factory forum, he probably never imagined that his strategy would become this popular and profitable. Today, it is recognized as one of the best trading setups in RTM (Read The Market) price action. Simply search his name online—even in Persian—and you’ll see how widely his methods are discussed and recommended as a reference for price action trading.
In this article, we will analyze the QM trading setup so you can apply it to your own trades.
What is a qm trading setup?
The QM trading setup in technical analysis, based on the Price Action RTM method, is one of the most popular trading strategies due to its high frequency of occurrence and favorable mid-to-long-term results. The QM setup is built on the concepts of support and resistance levels, price highs and lows, and stop-hunting. It identifies a high-probability zone with a favorable risk-to-reward ratio for traders, making it one of the most sought-after patterns in Price Action RTM.
Broadly speaking, the QM setup can be considered a more refined version of the Head and Shoulders pattern, though it can also be viewed as an independent and distinct pattern. In other words, this setup effectively addresses the weaknesses of the Head and Shoulders pattern, offering clearer entry and exit points.
However, the key aspect of the QM trading setup is that it often involves stop-hunting by big players or market makers. Traders may anticipate a breakout or a price surge based on support/resistance levels, but large institutional traders—driven by their own strategies—push the market in the opposite direction.
How to use qm setup
To effectively utilize the QM trading setup, follow these steps:
- Draw Trendlines and Support/Resistance Levels:
- Start by plotting trendlines and identifying key support/resistance levels on a suitable timeframe (this setup works across all timeframes).
- Look for a Head-and-Shoulders-Like Pattern:
- Search for swing highs (peaks) and swing lows (troughs) resembling the Head and Shoulders structure.
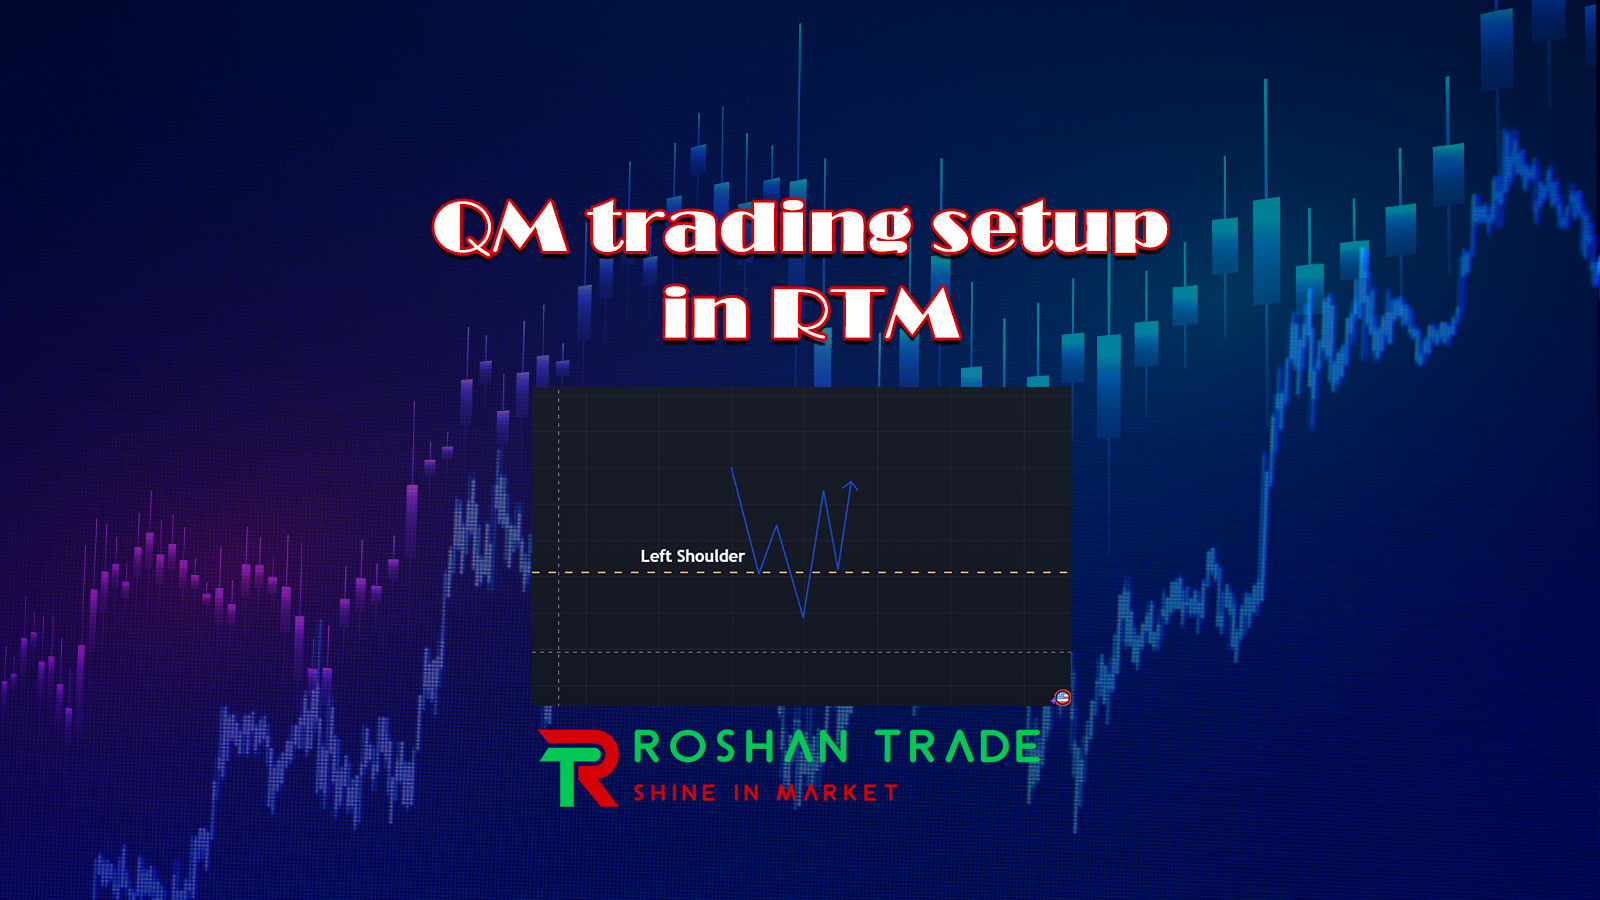
- Confirm the Left Shoulder and Head:
- Once the left shoulder and head are formed, prepare for the setup.
- Draw a Horizontal Line at the Left Shoulder’s Peak:
- Use charting tools (e.g., TradingView) to draw a horizontal line at the left shoulder’s high.
- Monitor the Right Shoulder Formation:
- As the right shoulder develops, watch the horizontal line closely.
- Enter a short trade if:
- Price rejects or approaches the horizontal line (near the left shoulder’s high).
- No new higher high forms above the left shoulder’s peak.
Types of QM trading patterns
Like most price action patterns, the QM trading setup is divided into two types: bullish and bearish.
QM bearish setup
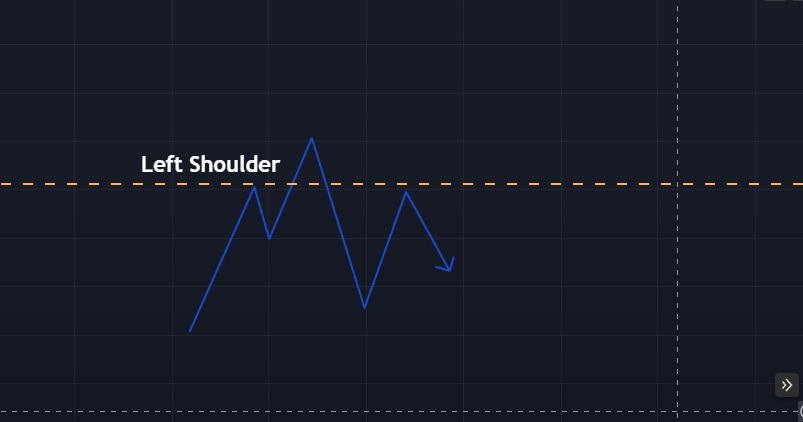
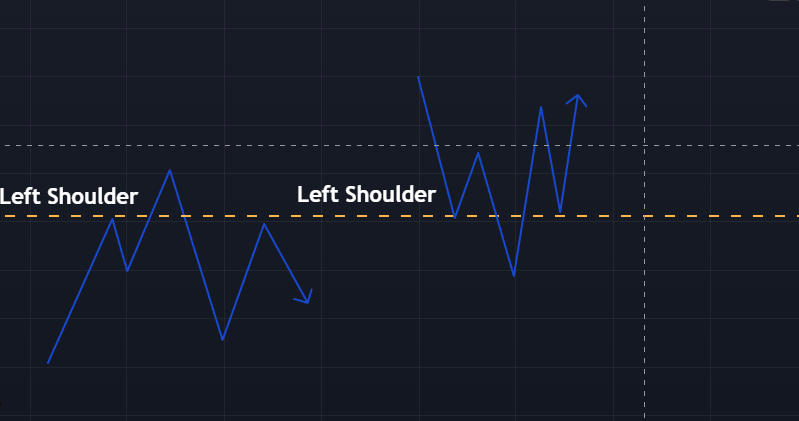
In a bearish QM trading setup, after the formation of the left shoulder and head in a head and shoulders pattern, the second price low (the low between the left shoulder and the head) is lower than the first price low. As a result, we again expect a price correction up to the resistance level of the left shoulder’s peak. This point could be a good entry for a short position. As for the target, we can anticipate a price decline at least down to the support zone.
Bullish QM setup
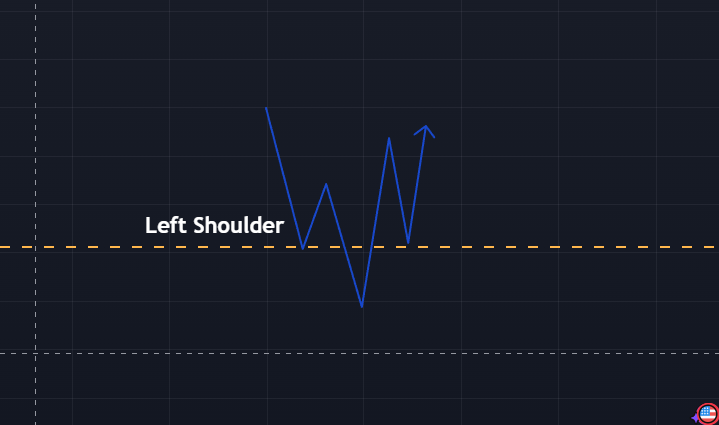
In a bullish QM trading setup, after the formation of the inverse left shoulder and head in an inverse head and shoulders pattern, the second price high (the high between the left shoulder and the head) is higher than the first price high. As a result, we again expect a price correction down to the support level of the left shoulder’s trough. This point could be a good entry for a long position. As for the trade target, we can anticipate a price increase at least up to the resistance zone.
Generally, this pattern performs exceptionally well in trend reversals and can also be utilized in pullbacks. As mentioned, the QM trading setup complements the head and shoulders pattern, and the head and shoulders pattern itself is considered a trend-reversal pattern.
QM pattern recognition method
Here’s the professional English translation of your trading strategy explanation:
Step 1: Begin by drawing trendlines, identifying support/resistance levels, and using technical indicators to determine the overall market trend. If multiple confirmations suggest a potential trend reversal, watch for the development of the QM trading setup. Note that external factors (e.g., economic news) may prevent this pattern from forming altogether. Until the second price peak/trough is established, you cannot confidently confirm the QM setup—or even a head and shoulders pattern.
As you know, divergence occurs when an indicator’s momentum disagrees with price movement. This signals severe weakness in the trend and a potential reversal. The QM setup frequently exhibits this behavior: While price rallies during the “head” formation, indicators like the RSI often show opposing signals. Thus, divergence serves as a reliable early warning for QM or head and shoulders patterns.
Another critical aspect of the QM setup is accurate support/resistance identification. For this, we recommend using Fibonacci retracement levels—though any tool that helps you plot valid S/R zones is acceptable.
How to trade with the qm trading setup in RTM style
Let’s return to the QM setup trading method in the RTM (Read The Market) style. The head and shoulders pattern, which is used to form the QM trading setup, develops in several stages.
Step-by-Step Formation of the QM Setup
- Initial Range & Swing
- You’ve already drawn support and resistance zones, and price is oscillating between them.
- Price moves up from near support toward resistance.
- At this point, many traders wait to see how price reacts at resistance.
- Failed Break & Left Shoulder Formation
- Suppose price fails to break resistance and starts declining.
- This is likely the formation of the left shoulder.
- Retest of Support & Trader Psychology
- Price returns near support. If it holds, some traders exit their positions, expecting another rally toward resistance.
- However, due to the perceived strength of resistance, others may anticipate another drop and re-enter short positions.
- Smart Money Intervention & Head Formation
- At this stage, big players (smart money) often step in, triggering stop losses of many traders.
- This creates a false breakout above resistance, forming the head of the pattern.
- Price then reverses downward again.
- Confirmation of QM Setup
- The head and shoulders pattern is now taking shape.
- Traders watch for the second low—if it’s lower than the first low, the QM setup is confirmed.
- The ideal entry for a short position comes when price retests the left shoulder’s peak level.
- With a high-probability setup, traders can sell here, targeting at least the support zone.
Important points of the QM model
It is clear that if the second price low is higher than the first price low, the QM trading setup does not form, and a head and shoulders pattern is developing. Therefore, we recommend not rushing into the QM trading setup during its formation.
Additionally, in this pattern, a peak forms, followed by a trough, and then a higher peak than the first. After that, another trough appears, which is lower than the first. Once this pattern is confirmed on the chart, you should prepare for the QM trading setup.
The QM trading setup, or the Quasimodo strategy, is a trend reversal strategy, and the most important task for traders is to identify it in time. However, recognizing this setup early can be challenging, which is why we recommend mastering candlestick patterns before entering a trade.
Conclusion
Currently, there are numerous trading setups for capital markets, each with its own advantages and disadvantages. The QM trading setup is among the newest and most successful strategies, evolving from the classic head and shoulders pattern into a refined and highly effective trading tool. Empirical evidence suggests that its risk-reward ratio significantly outperforms the traditional head and shoulders pattern.
In this article, we have covered all the essential aspects of mastering the QM trading setup. We strongly recommend practicing it repeatedly in a demo account to ensure compatibility with your trading strategy and to maximize profitability.