In today’s financial markets, you can earn significant profits, but at the same time, they can also take a toll on you. Today, we’ll examine one of the most important and well-known phenomena—fakeouts or fake breakouts. This is a phenomenon that can trap inexperienced traders or create profitable opportunities for savvy ones. You’ve probably heard this term many times in technical analysis and are eager to learn what it is and how to identify it.
The most common question people ask when encountering this phenomenon is: How can they use it to improve their trading strategy?
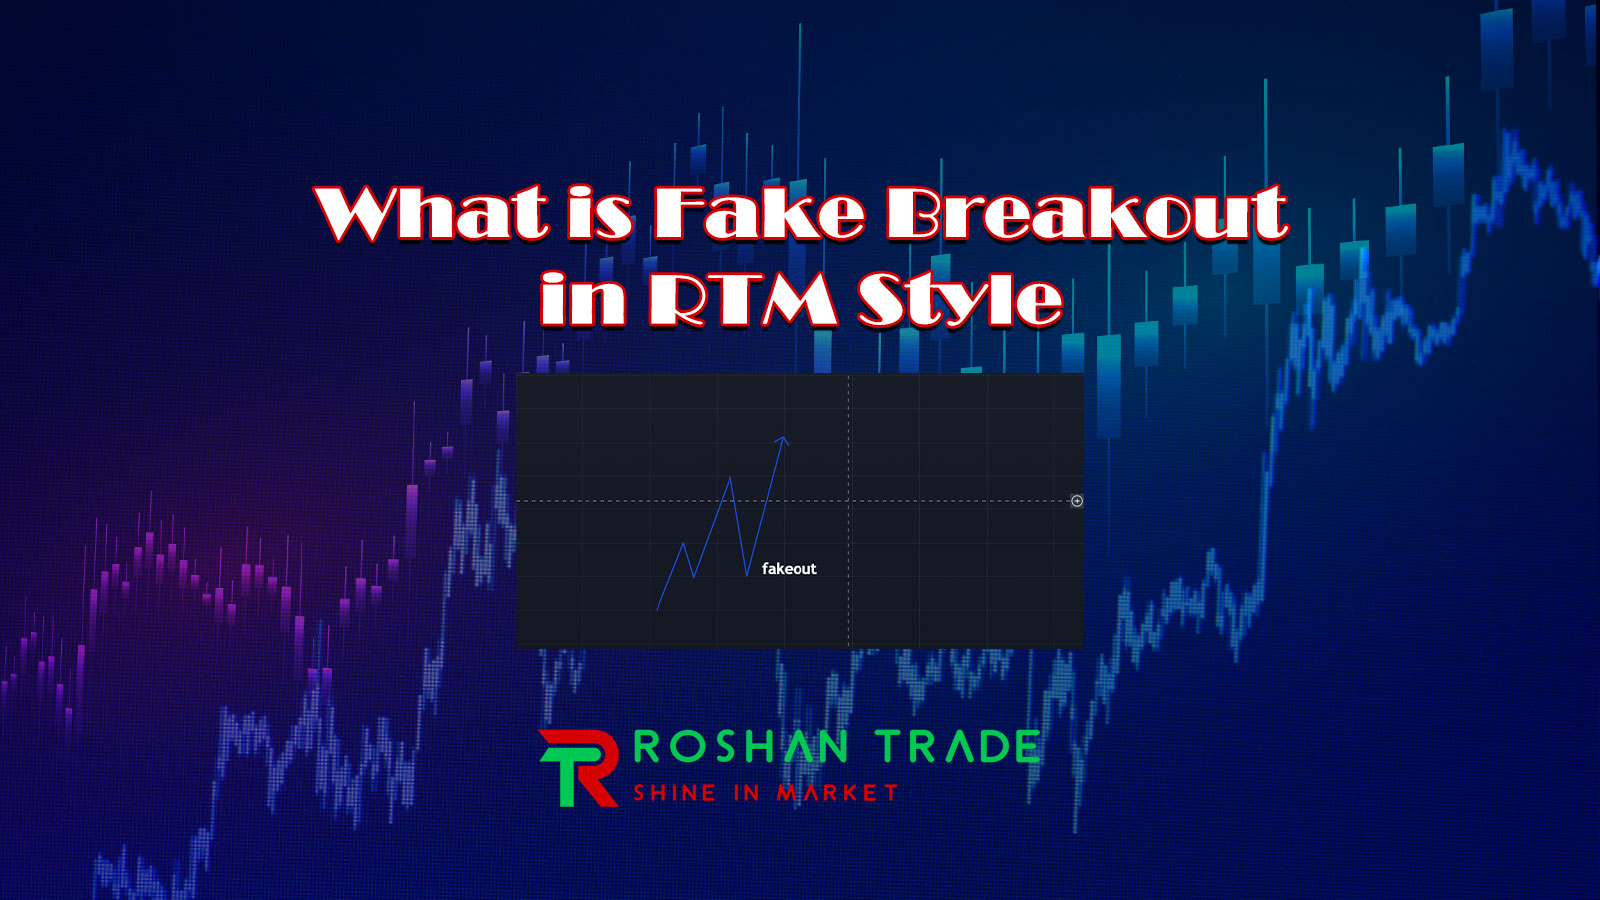
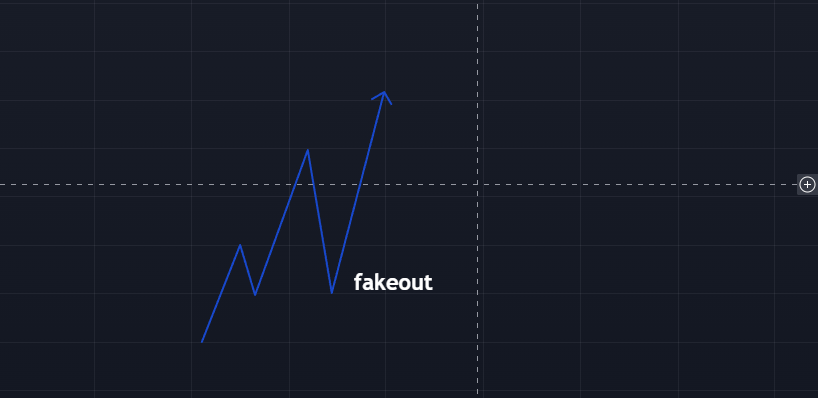
A fake breakout (fakeout) occurs when the price breaks through a support or resistance level, leading traders to expect a continuation of the move. However, the price doesn’t follow through and instead reverses direction. This forces traders to exit their positions, while others see it as a signal to trade in the opposite direction.
This is a general explanation of fakeouts, serving as a mental framework for the rest of this article. Here, we’ll dive deeper into fake breakouts—what they are and how to use them in trading to optimize your strategy. If you’re intrigued and want to learn more, keep reading!
What Is a Fake Breakout?
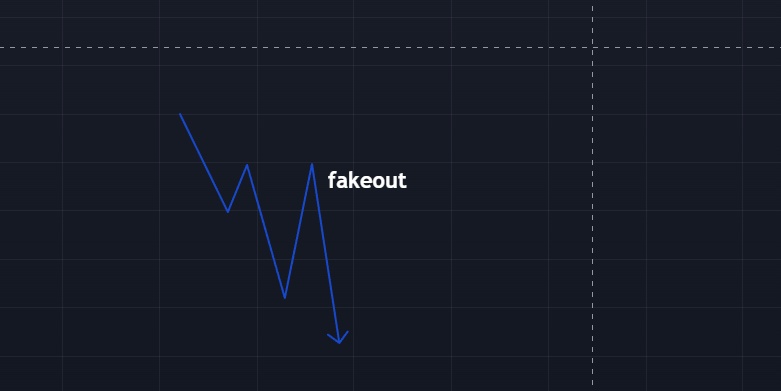
A breakout happens when the price breaks through a resistance, support, or trendline, signaling a new phase of movement. A fake breakout (fakeout), as the name suggests, is a false breakout—where the price moves outside the pattern but quickly reverses back inside. It’s also known as a failed break or false breakout.
Why Do Fake Breakouts Happen?
As mentioned, fake breakouts occur when the price appears to break a key level but quickly reverses, trapping traders who entered positions based on the initial move. These false moves are common in stocks, forex, and cryptocurrencies, often caused by:
- Market Manipulation – Large players push prices beyond key levels to trigger stop-loss orders or lure retail traders before reversing.
- Low Liquidity Periods – During off-hours (overnight/holidays), low liquidity can cause exaggerated price movements that reverse when normal trading resumes.
- News & Sentiment Shifts – A sudden news event may cause a temporary spike or drop, but if the underlying trend remains unchanged, the price often snaps back.
- Stop-Hunting – Brokers and big traders intentionally push prices beyond known levels to trigger stops before reversing.
Fake breakouts don’t happen randomly—they result from hidden market dynamics that manifest as false moves on the chart.
How to Identify a Fake Breakout
To avoid falling into the fakeout trap, you can use two key tools: trading volume and the RSI (Relative Strength Index).
Typically, the RSI is plotted below the main chart. If the price breaks a trend but the RSI shows bearish divergence and volume is declining, you’re likely dealing with a fake breakout.
For more precise detection, watch for these four signs:
- Weak Momentum in Indicators – If the price breaks out but indicators like RSI or MACD show weakening momentum, the breakout is suspect.
- Rejection Candles – Long wicks (shadows) or doji candles near support/resistance indicate rejection—a sign the breakout may fail.
- Lack of Follow-Through – A real breakout has strong volume and sustained momentum. If the price quickly reverses, it’s likely fake.
- Institutional Zones – Areas with heavy institutional interest (previous highs/lows) are prone to fakeouts as big players defend their positions.
How to Profit from Fake Breakouts
Now that you know how to spot fakeouts, let’s discuss profitable trading strategies:
1. Wait for Confirmation
Instead of jumping in immediately, wait for:
- A full candle close beyond the level (e.g., above resistance).
- A retest of the broken level to confirm it holds as new support/resistance.
2. Fade the Breakout (Counter-Trend Trade)
If you suspect a fakeout, trade in the opposite direction:
- Short if price breaks resistance but reverses.
- Long if price breaks support but bounces back.
3. Use Stop-Losses Wisely
Place stops beyond recent swing highs/lows to limit losses if the trade goes against you.
4. Trade with the Higher Timeframe Trend
Fake breakouts often fail when they go against the dominant trend. For example, in an uptrend, a bearish fake breakout below support is more likely to reverse upward.
5. Recognize Trapping Patterns
Learn to spot bull traps (false breakouts above resistance) and bear traps (false breakouts below support) for high-probability reversals.
Final Thoughts
Fake breakouts can either wipe out your account or make you huge profits. Traders who learn to distinguish real breakouts from fakeouts no longer fall into institutional traps.
As you’ve learned in this article, fakeouts happen when least expected—but with the right techniques, you can identify and trade them effectively. Apply these strategies to refine your trading approach and avoid costly mistakes.
We hope this article was helpful! If you found it useful, share it with fellow traders so they can benefit too. Happy trading! 🚀