What is RBR?
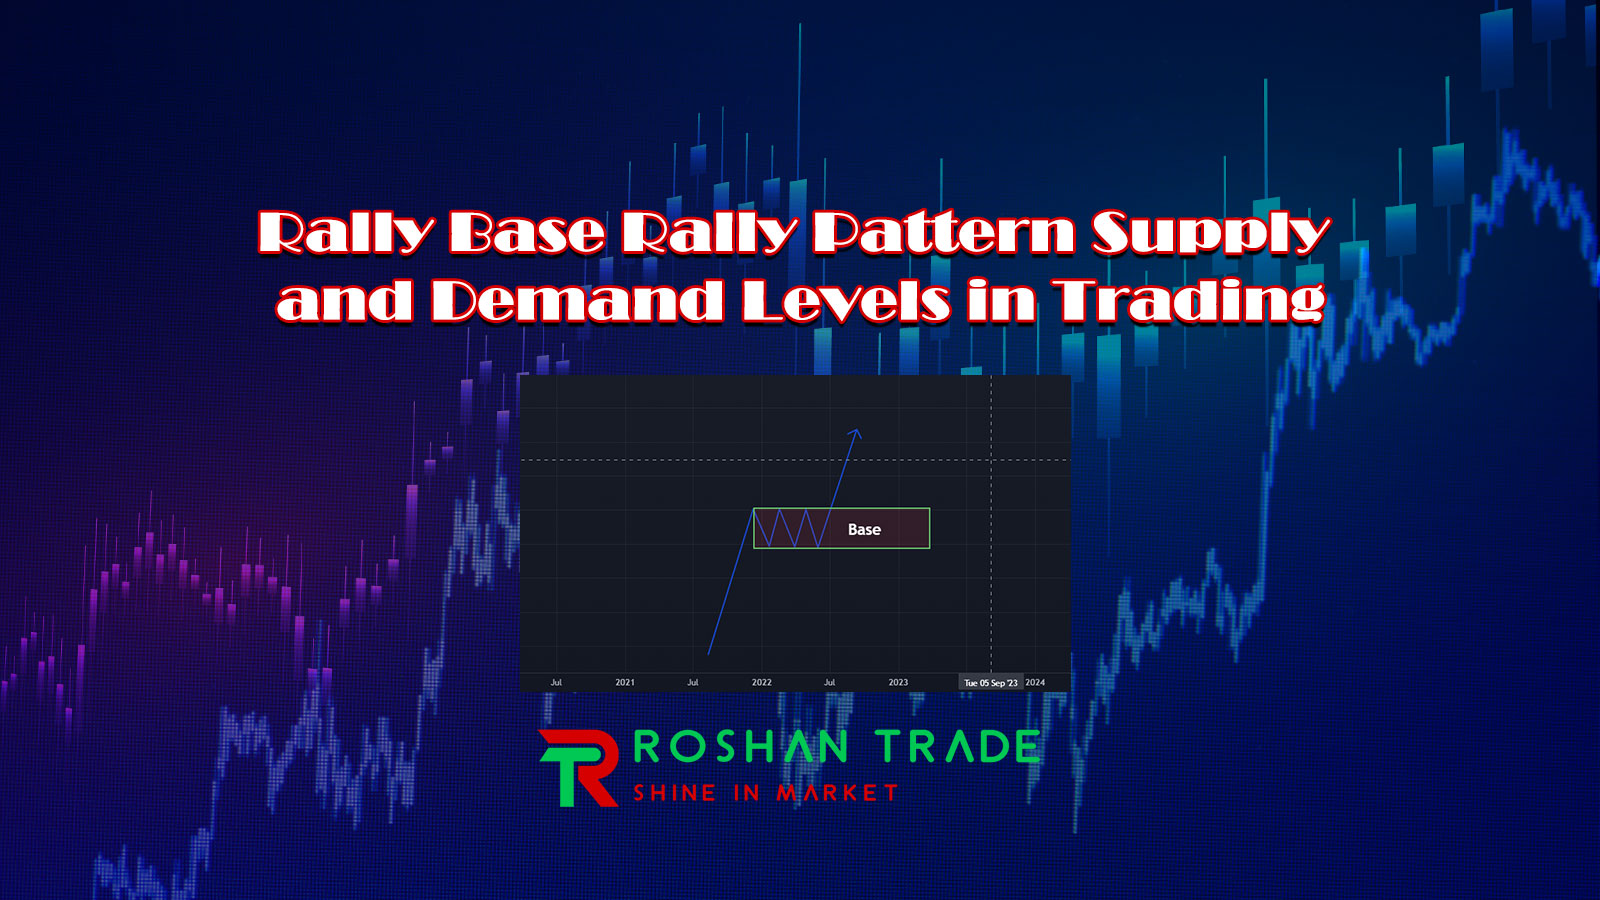
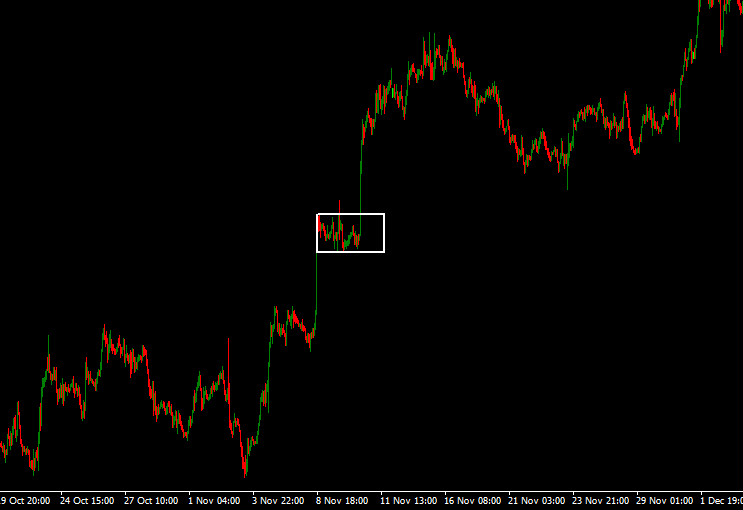
The Rally Base Rally (RBR) pattern is a price pattern that specifically helps identify the demand zone on a price chart. This pattern provides traders with a suitable entry point where demand in the market increases, and there is a potential for price growth.
In the Rally Base Rally pattern, the price retraces to a specific zone and, after an upward rally, enters a base zone, which signifies the accumulation of buying power. This is a type of supply and demand in trading. Supply and demand are the foundation of technical analysis trading. Without understanding these basic principles, you cannot become a professional analyst.
How to identify the rally base rally pattern?
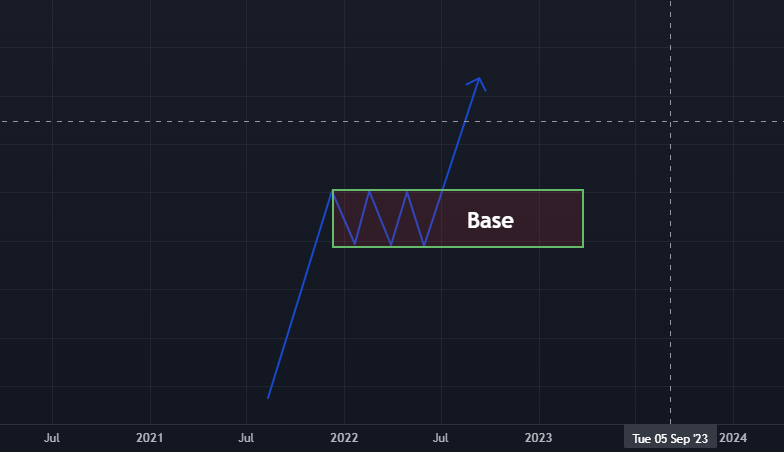
In RBR, a base area is located between two rallies or uptrends. The base area represents the demand area. A simple form of this RBR pattern consists of three candlesticks.
There is a simple formula for identifying RBR patterns in trading
Rally Base Rally = Large Bullish Candle + Base Candle + Large Bullish Candle
What is a candlestick?
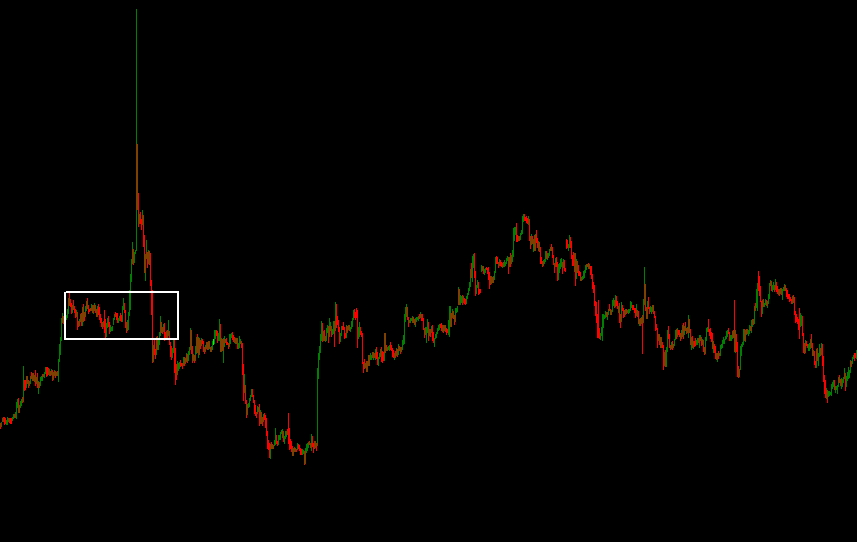
The Base Candle consists of one or more candlesticks that reflect the tension between buyers and sellers in determining the price direction. Typically, base candles have small bodies and are also referred to as trading nodes.
Sometimes, gaps are considered as base candles. Gaps occur due to the release of good or bad news in the market and can serve as strong support or resistance zones.
Candle Base Features
Base candles usually have a small body and form at the end of an uptrend or downtrend. They can also appear as gaps. Gaps can create areas of support or resistance, depending on whether good or bad news is being released.
Candlestick recognition
It is very easy to identify a candlestick base on a chart. When you see a candlestick on the price chart that has a small body and long shadows and is formed at the end of a downtrend or uptrend, that candlestick can be a base candlestick.
How to identify the rally base rally pattern?
To identify a good rally base rally (RBR) pattern, there are two criteria you should follow.
- The body to wick ratio of the two large candlesticks should be greater than 70% of the total candlestick size.
- In the case of the base candle, the body to wick ratio should be less than 25%.
What does the RBR rally base pattern tell traders?
This pattern creates a demand zone on the price chart. The demand zone indicates significant buying interest in that area. Large institutions and major banks are actively looking to buy in this zone. The demand zone attracts attention from big traders.
The RBR pattern helps us identify areas that are being targeted by major market players. Price only moves upward when demand outweighs supply.
The base area in the RBR pattern represents the footprint of institutions. You should follow these footprints to track real money flow. In some ways, this pattern resembles the Drop Base Rally (DBR) pattern.
How to trade in the rally base demand zone?
A simple and straightforward rule for trading in the demand zone is to buy in that zone.
There are two methods for trading in the Rally Base Rally (RBR) demand zone:
- After the base zone is formed, if the price suddenly retraces to the base zone, we should open a trade.
- If the price does not immediately return to the base zone after its formation and takes several candlesticks to retrace back, we should wait for the price to return to the zone and then enter the trade after a bullish candlestick pattern (such as a hammer, bullish engulfing, or piercing pattern) is formed.
A bullish candlestick pattern in the base zone increases the probability of reaching profit targets.
Demand area weakness
The main drawback of the demand zone is that it does not indicate the take profit level. You can open an order and set a stop loss, but you cannot predict the take profit level. That is why you should use other patterns such as Fibonacci retracements to identify take profit levels.
Conclusion
Sometimes, identifying the Rally Base Rally (RBR) pattern on candlesticks can be challenging (due to the base forming across multiple candles). For this reason, traders use specialized tools to visualize this pattern. On TradingView, you can utilize Rally Base indicators to detect it more easily.
The Rally Base Rally pattern is a high-probability price action setup. Once an RBR forms, you shouldn’t miss the buying opportunity.
Remember:
- To master this pattern, you must backtest it at least 100 times.
- Never use it in isolation—combine it with other confirmations (e.g., trend analysis, volume, or support/resistance).