In 2025, financial markets are undergoing unprecedented changes at a rapid pace. Day traders require accurate and efficient analytical tools to succeed in this dynamic environment. Indicators, as one of the most important tools of technical analysis, play a vital role in trading decisions. In this article, we will examine the best indicators for day trading in 2025 that can help traders operate with more confidence in financial markets.
Reading suggestion: 5 best indicators for beginners
1. MACD (Moving Average Convergence Divergence)
The MACD indicator (Moving Average Convergence Divergence) is one of the daily indicators used to identify changes in strength, direction, momentum, and duration of a trend in financial markets. This indicator consists of three main components: the MACD line, signal line, and histogram. The MACD line is derived from subtracting the 26-period exponential moving average from the 12-period exponential moving average. The signal line is a 9-period exponential moving average of the MACD line. The histogram represents the difference between the MACD line and the signal line. When the MACD line crosses above the signal line, a buy signal is generated, and when it crosses below, a sell signal is generated.
2. Stochastic
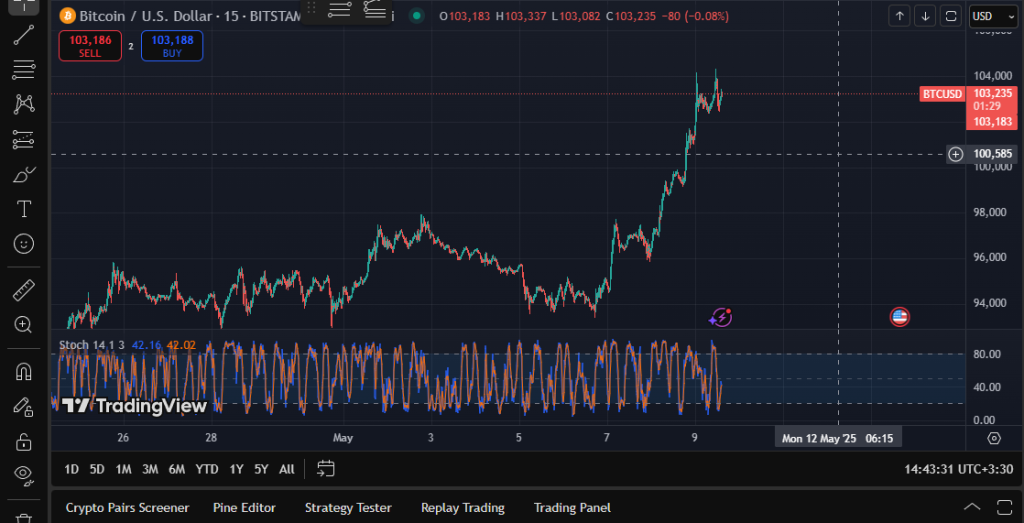
The Stochastic indicator is another important tool in technical analysis used to identify overbought and oversold conditions. This indicator operates on the premise that prices tend to close near their highest levels in upward trends and near their lowest levels in downward trends. The Stochastic indicator features two lines: %K and %D. The %K line shows the current closing price relative to the price range over a specified period, while the %D line is a 3-period moving average of the %K line. When the %K line crosses above the %D line, a buy signal is generated, and when it crosses below, a sell signal is produced.
3. ATR (Average True Range)
The ATR (Average True Range) indicator is considered one of the best indicators for day trading as it measures price volatility over a specified period. Unlike many other indicators, it does not help identify market direction but focuses on the magnitude of price changes. ATR is calculated based on the average true range over a specified time period (typically 14 periods), and the higher the ATR value, the greater the market volatility. This indicator assists traders in gaining a better understanding of market risk and price fluctuations and is used for setting stop-loss levels and identifying market volatility.
4. OBV (On-Balance Volume)
The OBV indicator (On-Balance Volume) is a key tool in technical analysis, introduced by Joseph Granville in the 1960s. This indicator helps traders measure buying and selling pressure based on changes in trading volume. The basic idea behind OBV is that trading volume typically changes before price changes. In other words, if trading volume is increasing and price rises, it indicates that investors are entering the market, suggesting a potential upward trend. Conversely, if trading volume decreases while price also declines, it signals that investors are exiting the market, indicating a possible downward trend. The OBV indicator is displayed as a line below the price chart, and traders use its direction and divergences with price for decision-making.
5. Ichimoku Cloud
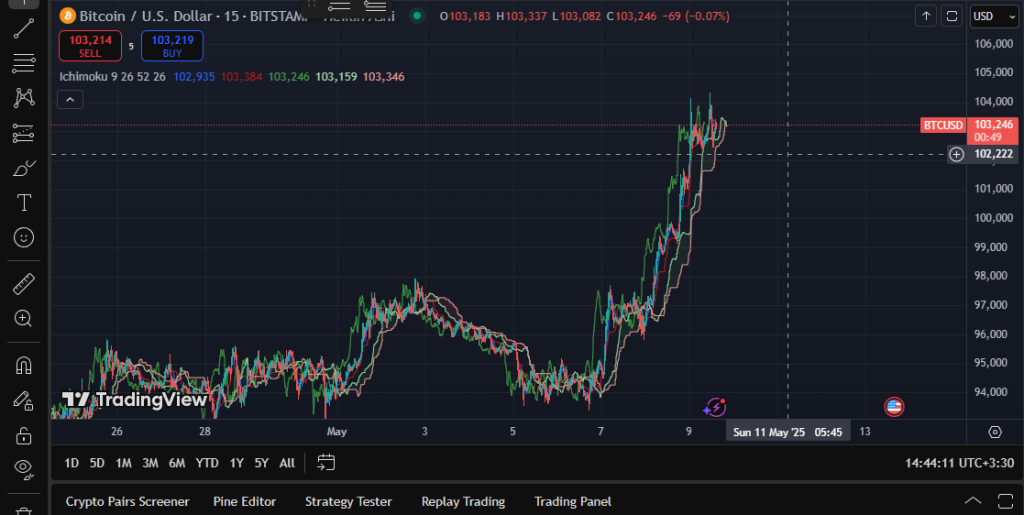
The Ichimoku Cloud (also known as Ichimoku Kinko Hyo) is a versatile tool in technical analysis, introduced by Japanese journalist Goichi Hosoda in the 1960s. This indicator assists traders in quickly identifying market trends, support and resistance levels, and trading signals at a glance. The Ichimoku Cloud consists of five main components: Tenkan-sen (conversion line), Kijun-sen (base line), Senkou Span A (leading span A), Senkou Span B (leading span B), and Chikou Span (lagging line). The Tenkan-sen and Kijun-sen are calculated as 9-period and 26-period moving averages, respectively, while the leading spans A and B create the cloud, which indicates future support and resistance levels. The Chikou Span compares the current closing price with the price from 26 periods ago.
6. Parabolic SAR
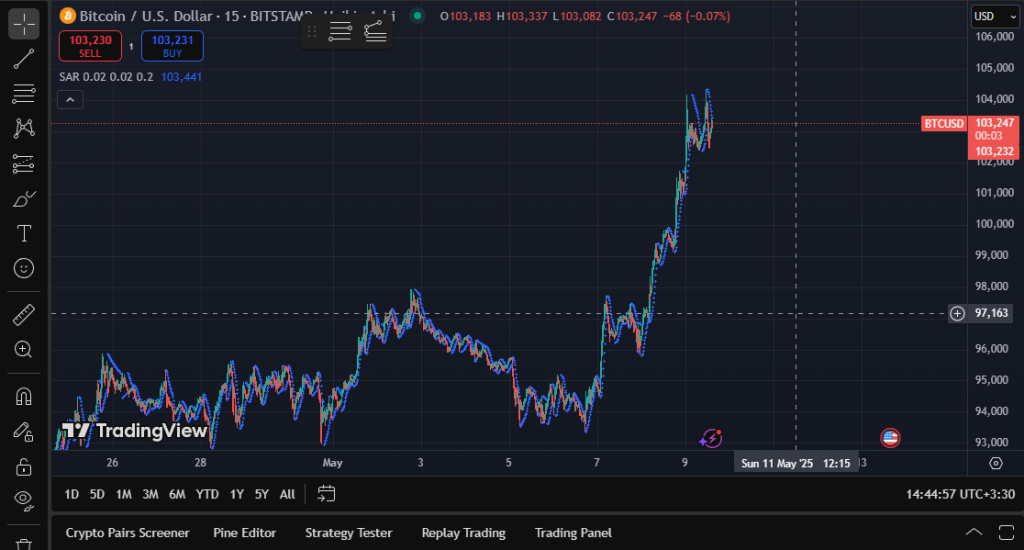
The Parabolic SAR (Stop and Reverse) indicator, introduced by Welles Wilder in 1978, is an important tool in technical analysis used to identify reversal points and determine market trend direction. The name of this indicator originates from “Stop and Reverse,” indicating its purpose of signaling potential trend changes. The Parabolic SAR appears as dots above or below the price chart. When the dots are positioned above the price, it indicates a downward trend, while dots below the price signify an upward trend. This indicator is useful for setting stop-loss levels and is particularly effective in trending markets, allowing traders to capitalize on trends and potentially achieve greater profits.
Conclusion
Using the best indicators for day trading can make a significant difference in your trading results. Each of these top 6 indicators has unique features and applications that can assist you in analyzing the market more accurately and making better decisions. By leveraging these tools, you can gain a deeper understanding of market trends and fluctuations, thereby enhancing your trading strategies. Selecting the best daily indicators and utilizing them wisely is the key to success in day trading.