In recent years, it has become clear to investors that predicting the price movement of cryptocurrencies is not an easy task. While some days cryptocurrencies experience an upward trend, the price can change to a downward trend at any moment, turning all the profits gained into losses within minutes. For this reason, investing and trading in the cryptocurrency market involves significant risks and dangers, and not all investors succeed in this market.
However, crypto trading enthusiasts are not defenseless against severe price fluctuations; there are tools available to help them predict price trends and make more informed decisions. These tools are referred to as indicators.
Indicators come in various types, and each can be effective under specific conditions. Nowadays, indicators are used to analyze different market trends, and one of their main applications is in detecting bullish, bearish, and neutral price trends of cryptocurrencies. But what are the best indicators for trend detection?
Reading suggestion: Best Indicators for Day Trading in 2025
1. Relative Strength Index (RSI)
The Relative Strength Index (RSI) is a technical analysis indicator that moves between 0 and 100, providing valuable information regarding the price movements and trends of cryptocurrencies for investors.
One way to use the RSI indicator is to identify overbought and oversold positions based on the number indicated by this metric. When the RSI exceeds 70, it indicates that the market may be overbought, suggesting a potential decrease and price correction. Conversely, when the RSI shows a value below 30, it suggests that the cryptocurrency market may be oversold, indicating that the price trend could be poised for an increase.
In strong bullish trends, the RSI often reaches above 70 and maintains this level for a period of time, while in strong bearish trends, the RSI stays below 30 for an extended duration.
Although the overbought and oversold signals from this indicator are generally accurate, relying solely on the RSI cannot swiftly identify the best buying and selling points and is usually employed as a confirmation of price trends.
For this reason, alongside the RSI indicator, other indicators like Moving Averages (MA) are used to determine trend direction.
2. Moving Averages (MA)
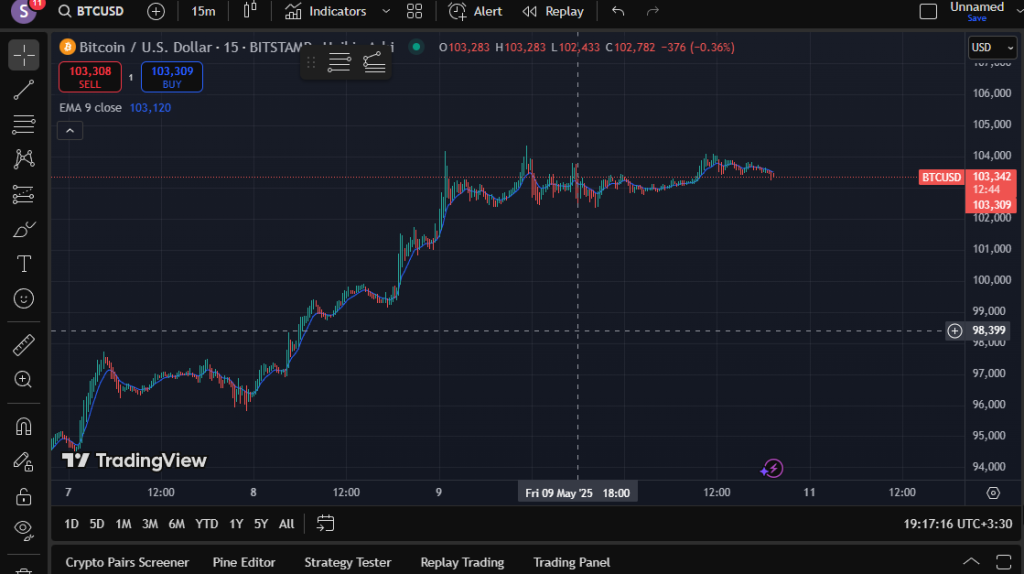
The Moving Average, or MA, is a technical analysis tool that illustrates price data by creating a constantly updated average price. In price charts, the moving average line helps traders eliminate random price fluctuations and gain a better perspective on cryptocurrency price changes.
Moving averages are applied over specific time frames, which can vary from minutes to days, depending on the trader’s preference. For long-term investors and trend followers, popular choices include the 200-day, 100-day, and 50-day simple moving averages.
There are various ways to use moving averages. The first is to observe the angle of the moving average. If the moving average line has been moving horizontally for an extended period, it indicates that the price is consolidating. Consolidation refers to a period where the price moves consistently between established high and low ranges.
If the moving average line trends upward, it indicates that a bullish trend is in progress, while a downward trend suggests a bearish market. As evident, moving averages cannot provide precise predictions of future price trends; they merely show how the price has moved on average over a specific time period.
However, traders can utilize moving averages alongside other analytical methods to gain valuable insights into the future price trends of cryptocurrencies.
One of these methods is crossover analysis. By plotting multiple moving averages, traders can identify certain signals for buying and selling cryptocurrencies. For example, with a 200-day and 50-day moving average plotted on the chart, a buy signal occurs when the 50-day moving average crosses above the 200-day moving average, while a sell signal arises when the 50-day moving average falls below the 200-day moving average.
Analyzing price in relation to moving averages can provide valuable insights for traders. When the price crosses above the moving average, it can be seen as a buy signal, whereas when the price drops below the moving average line, it can be interpreted as a sell signal.
Moving averages can also be utilized to identify support and resistance levels. Therefore, moving averages play a crucial role in identifying and trading price trends, and they are widely used by market traders.
However, it is important to note that, like other market indicators, moving averages can sometimes generate false signals. For this reason, traders perform their own analyses and assessments in addition to using moving averages.
3. Bollinger Bands
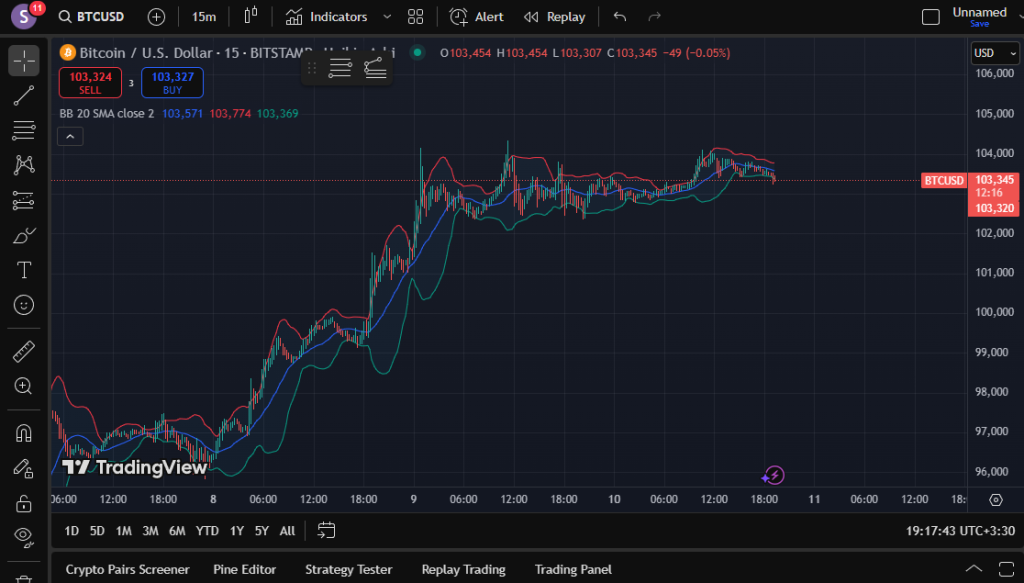
The Bollinger Bands indicator is another popular tool for identifying overbought and oversold levels. This tool consists of three lines (bands):
- The middle band is a 20-day simple moving average (SMA), and the upper and lower bands are calculated based on the standard deviations of this SMA.
When the price of an asset falls below the lower Bollinger Band, it can be seen as a sign of excessive price decline in a downtrend, indicating that a new bullish trend may begin. Conversely, when the price exceeds the upper Bollinger Band, it suggests that the asset is in an overbought condition, which may lead to a potential bearish trend.
According to the website school.stockcharts, Bollinger Bands can also be utilized in weak trends, such as sideways markets, because prices are likely to fluctuate between the upper and lower bands.
Given that a market can remain in overbought or oversold conditions for extended periods, the Bollinger Bands indicator is more useful for helping traders identify suitable entry and exit points rather than determining the direction of the trend.
Remember, it is always important to use a combination of indicators and analytical tools to confirm signals and protect trades with sound risk management practices. This is because when prices reach specific ranges on any indicator, there are signals that require further examination before making decisions.
4. On-Balance Volume (OBV)
One of the best technical indicators for detecting trends is the On-Balance Volume (OBV) indicator. The OBV technical indicator is used to determine momentum. Momentum represents the speed and strength of market movements, indicating the direction and rate of upward or downward trends.
However, unlike momentum indicators, OBV utilizes trading volume data and price reactions to provide insights into market movements. By analyzing the relationship between volume and price changes, OBV helps traders gauge the strength of a trend and predict potential reversals.
Traders who utilize the On-Balance Volume (OBV) indicator believe that high levels of trading volume can ultimately influence prices and lead to significant price changes.
The OBV indicator calculates buying and selling pressure by summing the volume of trades on up days and subtracting the volume on down days. This indicator is best utilized for confirming trends and identifying the strength of price movements. For example, if the price of a cryptocurrency is in an upward trend, but the OBV line remains flat, it might indicate that trading volume is not supporting the upward trend, suggesting a potential reversal may occur.
OBV can also be used to identify suitable entry opportunities into price trends. For instance, when the OBV is reaching higher levels while the price is trending down, it can indicate a bullish divergence, with those price levels being recognized as potential buying and entry points.
The OBV indicator is most effective for confirming established trends or identifying price reversal points. To achieve the best results, it is recommended to combine OBV with other trading indicators, such as the Relative Strength Index (RSI) and the Moving Average Convergence Divergence (MACD) indicator. This combination allows traders to gain a more comprehensive view of market conditions and better assist in their trading decisions.
5. MACD
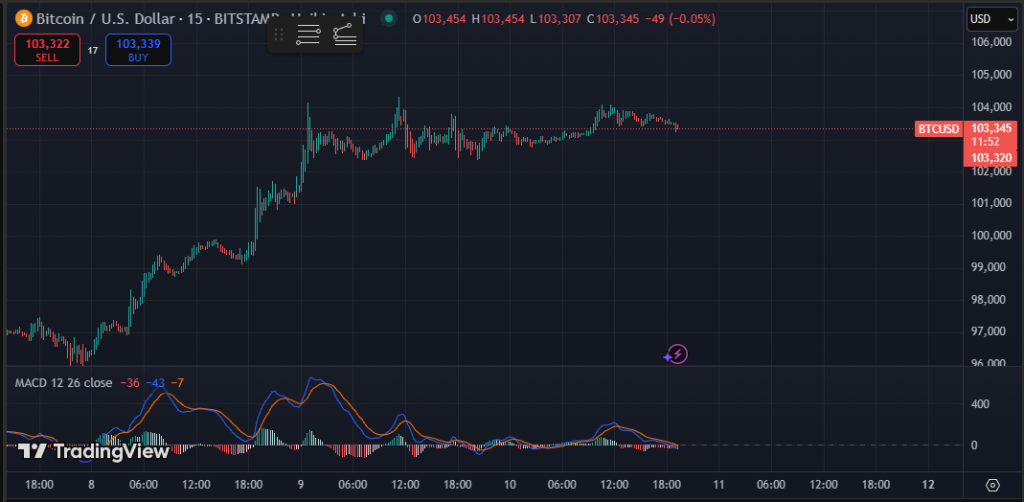
The Moving Average Convergence Divergence (MACD) indicator is a momentum oscillator derived from two moving averages. By default, the periods of these moving averages are set to 12 and 26 candles. The MACD can be used alone or in combination with other indicators to determine trends. If the MACD value is above zero, it indicates a bullish trend, while a value below zero signals a bearish trend. However, relying solely on this point is insufficient for trend identification.
A trend reversal from bearish to bullish occurs when the fast moving average (the one with the shorter period) crosses above the slow moving average (the one with the longer period) below the zero line. This crossover signifies the beginning of an upward trend. If these two lines increase and remain above the zero line, the trend remains bullish until the lines drop below zero again. It’s important to note that a crossover of the two moving averages above the zero line can indicate a correction within the bullish trend. This condition can also be utilized for making entry and exit decisions in trading.
In summary, the MACD not only provides a clear indication of trend direction but also highlights potential points for entering and exiting trades based on crossovers and the positioning of the moving averages in relation to the zero line.
Conclusion
In this article, we introduced and examined some of the best trend detection indicators. These indicators are widely used by market traders, either on their own or in combination with other indicators and metrics, to identify the direction and strength of trends. This information can help you make better trading decisions, which is why it is important to familiarize yourself with them and learn how to effectively utilize the various market indicators.
While you can use these indicators and trading strategies regardless of your trading experience level, it is crucial to note that professional and successful traders are continuously refining their strategies, developing new approaches, and acquiring new skills and knowledge. Therefore, merely learning a few indicators is not sufficient for profitable trading; cryptocurrency enthusiasts must always work to enhance their knowledge and skills in order to secure profitable trades.
Studying how professional market participants invest and trade, participating in educational courses, and obtaining trading education packages are some of the avenues available to help you learn the best trend detection indicators and use them effectively.