roshantrade

roshantrade

What is the CP Compression Pattern in RTM Price Action?

What is the CP Compression Pattern in RTM Price Action?

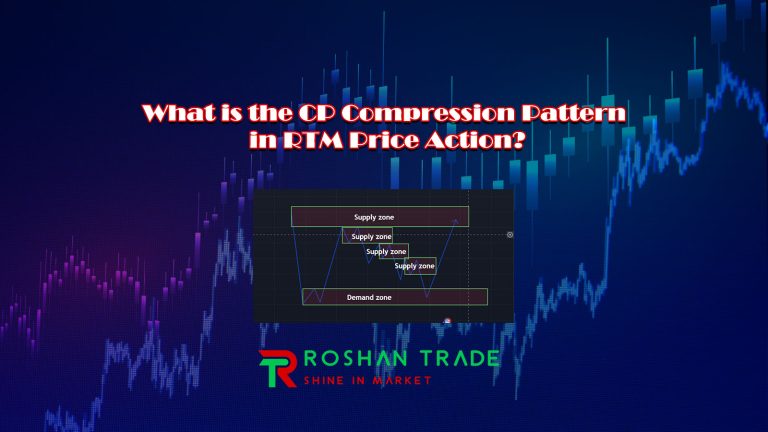
The CP (Compression) pattern in RTM (Read The Market) price action is a trend-reversal pattern, indicating that the market trend is likely to reverse in the near future. If you observe the CP pattern closely, you’ll notice that it resembles a parabolic wedge pattern. The CP pattern is one of…

Types of Engulfed in RTM Price Action

Types of Engulfed in RTM

What is the concept of engulf in RTM? In the RTM (Read The Market) style, traders need some form of proper confirmation to enter trades. An engulfing candle that forms at key levels can serve as a suitable confirmation for…

What is Flag Limit (FL) in RTM?

What is Flag Limit (FL) in RTM?

What is Flag Limit (FL)? Flag Limit (FL), abbreviated as FL, is one of the most widely used concepts in technical analysis, particularly in the RTM (Read The Market) style. This concept helps traders identify potential price reversal points in the market. The Flag Limit acts…

Swap Pattern in RTM Price Action

Swap Pattern in RTM Price Action

“Swap” or “Reversal is a concept that states: Whenever there is a strong supply or demand zone (such as FTR, FL, or CAPS), but the price disregards it and breaks through forcefully, the role of that zone will reverse. This means…

What is Diamond Pattern in RTM?

Diamond Pattern in RTM

The Diamond pattern is one of the key Price Action patterns in RTM (Read The Market). The Diamond is a highly deceptive pattern that can mislead both buyers and sellers, providing significant liquidity for institutions and major market players. In this article,…

What is Can Can Pattern in Rtm?

Can Can Pattern in Rtm

The Can Can pattern in RTM can be a powerful and effective strategy for traders. By examining what it is, how it works, and why it is important, you can consider this pattern for optimizing or building a trading strategy.…

7 Best Indicators for Weekly Charts

best indicators for weekly charts

Weekly charts are one of the best options for traders to capture swings, known as swing trading. Traders who aim for long-term investment find weekly charts particularly useful as they provide a broader perspective of the market. These charts help traders identify trends, key support and resistance…

The Best 5 Indicators for Beginners + How to Use

Best Indicators for Beginners

If you’re new to trading, investing, or data analysis, understanding and using indicators can seem overwhelming. However, indicators are powerful tools that can help you make informed decisions by providing insights into market trends, performance, and potential opportunities. This article…

What is the Best Trading Style?

best trading styles

Choosing the best trading style is one of the most important decisions you’ll make as a trader. Your trading style will determine how often you trade, the time you dedicate to the markets, and the strategies you use. However, there’s…