The Can Can pattern in RTM can be a powerful and effective strategy for traders. By examining what it is, how it works, and why it is important, you can consider this pattern for optimizing or building a trading strategy. In the continuation of this article, we will delve into the Kin-Kin pattern and explore how to implement it. Stay with Roshan Trade until the end of this article.
Reading Suggestion: What is Diamond Pattern in RTM?
What is the Can Can Price pattern?
The Can Can pattern is one of the most important reversal patterns that forms at the beginning of the Caps pattern and after the compression pattern, providing a strong zone for price reversal where you can execute trades.
In a bearish Can Can pattern, first, a rally candle (a sharp upward movement with momentum candles) forms, followed by a base candle. This means we initially have a rally-base-rally sequence. The base candle creates an Authentic Zone, after which the price moves down, and a drop candle pulls this zone downward.
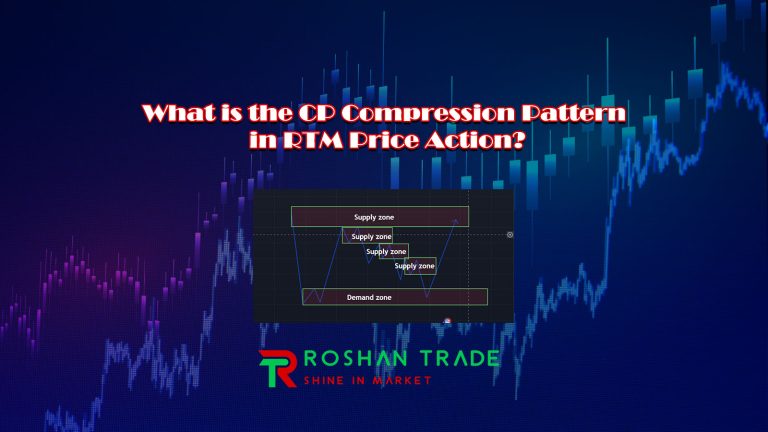
Subsequently, the price moves upward again, forming a compression pattern, and heads toward the Caps zone. When it reaches the supply zone of Caps, the price moves downward with significant force, signaling the Can Can pattern.
Key Point: In the compression pattern (Cp), the price starts moving from a demand or supply zone and creates consecutive supply or demand zones along its path. These zones are tested, and buy or sell orders are filled by traders, leading to a slowdown in the market trend. When the price reaches a supply or demand level, a trend reversal occurs in the market.
Important Notes:
- Caps Pattern: The zone where the price reverses after a compression.
- Compression Pattern (Cp): The price moves from a demand or supply zone, creating and testing consecutive zones, leading to a slowdown and eventual reversal.
- Authentic Zone: Created by the base candle, which is later pulled downward by the drop candle.
This pattern is crucial for identifying potential reversals and executing trades at optimal levels.
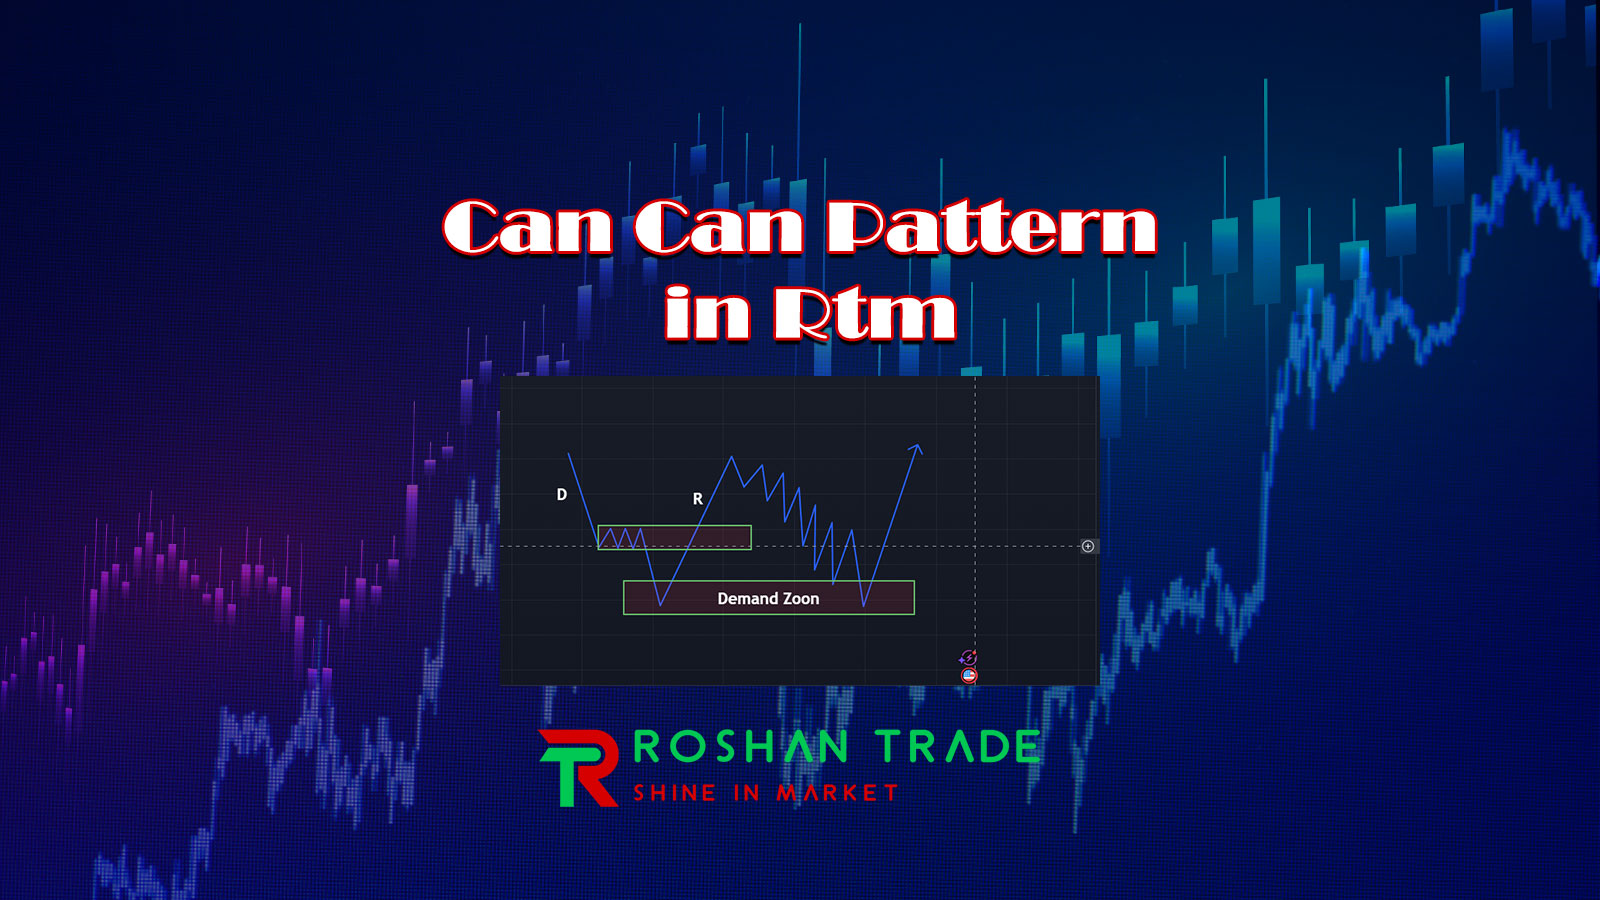
Bullish Can Can pattern
The Can Can pattern is divided into two parts: the bullish Can Can and the bearish Can Can. In this section, we will focus on the bullish Can Can pattern, where the price initially forms a DBD structure. This means that first, a drop candle forms, followed by a base candle, and then another drop candle—opposite to the rally-base-rally structure. In the drop-base-drop sequence, we first have a bearish momentum move, then a base, and then another bearish momentum move.
The base candle creates an Authentic Zone, and afterward, this supply zone is broken to the upside with strength by a rally candle.
Next, the price retraces and forms a compression pattern. In the compression pattern, the price creates consecutive zones, which are then retested by the price. Finally, after reaching the demand zone, the price changes direction and moves upward again.
Bearish Can Can pattern
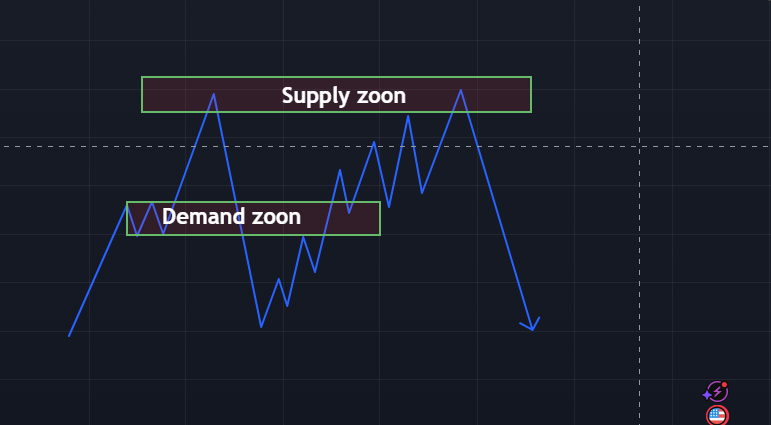
In the Bearish CAN CAN pattern, the price first forms an RBR structure. This means we initially have a Rally-Base-Rally. The base candle forms an Authentic Zone, and then this demand zone is powerfully broken to the downside with a drop candle.
Afterward, the price retraces and creates a compression pattern. In the compression pattern, the price forms consecutive zones, and these zones are retested by the price. Finally, after reaching the supply zone, the price reverses direction and moves downward again.
Ultimately, after reaching the supply zone, the price reverses direction and moves downward again.
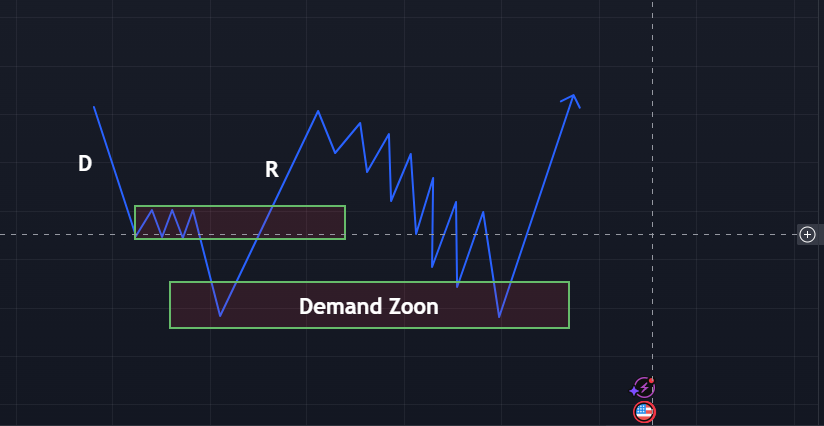
Learning to trade the bullish Can Can pattern
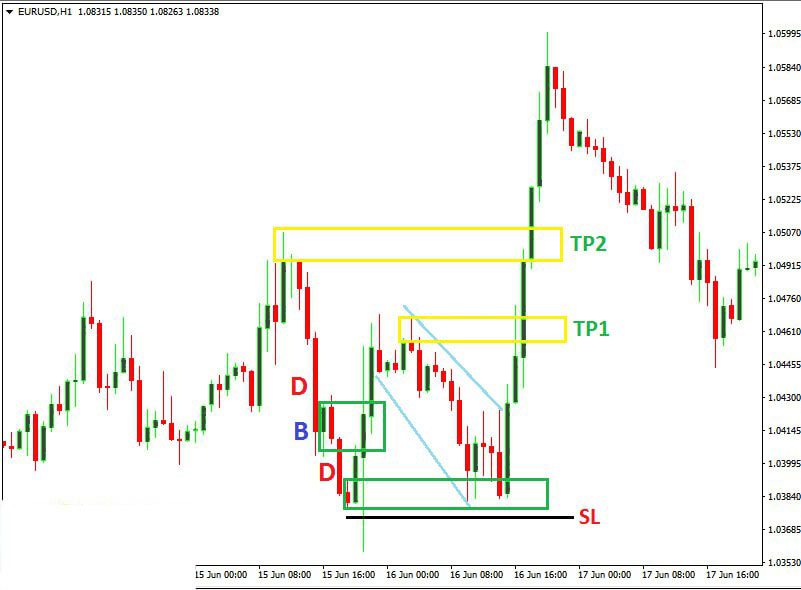
To observe the Bullish CAN CAN pattern, the DBD structure must first appear on the chart. Based on the base candle, we draw the Authentic Supply Zone. The price moves upward, fails to react to this zone, and breaks it to the upside.
Next, a compression pattern is formed, and consecutive supply zones are created. These zones are retested, preparing the market for a change in direction.
In this scenario, you should look for a suitable entry point to enter the market and place a buy order. Therefore, you place your buy order in the demand zone and enter the market.
Your stop-loss (SL) can be placed one tick below the demand zone, depending on the position. The take-profit (TP) can be set in two stages, as shown in the figure below.
Conclusion
The Can Can pattern is one of the most important price action patterns in RTM (Read The Market). It rarely occurs in the market, but when it does, it has a very high probability of success. By using this pattern, you can achieve significant profits. The Can Can pattern is essentially a combination of the Caps pattern and the compression pattern. Therefore, if you have a solid understanding of these two patterns, you can easily utilize the Can Can pattern and experience highly profitable trades.
In the Bullish Can Can pattern, the market trend shifts from bearish to bullish, and you should look for an appropriate opportunity to buy.
In the Bearish Can Can pattern, the market trend shifts from bullish to bearish, and you should look to sell in the supply zone.
If you found this tutorial helpful, please share your feedback with us!