
The Diamond pattern is one of the key Price Action patterns in RTM (Read The Market). The Diamond is a highly deceptive pattern that can mislead both buyers and sellers, providing significant liquidity for institutions and major market players. In this article, we will explore the Diamond pattern in RTM to fully understand the ins and outs of this pattern.
In the Diamond pattern, four engulfing candles occur, leading to the stop-loss of four groups of traders being triggered. Essentially, when our QM (Quasimodo) pattern fails, there is a possibility of the Diamond pattern forming.
Reading Suggestion: Inner Flag in RTM
How the Diamond Pattern Forms

The Diamond pattern is formed by four trendlines. The two upper trendlines act as resistance lines, while the two lower trendlines function as support lines. These lines connect the highest and lowest recent price points. In this pattern, price volatility is initially high but gradually decreases over time.
Simultaneously, the use of indicators such as MACD and RSI can serve as confirmatory tools for the potential formation of the Diamond pattern. These indicators can also help validate the breakout of support and resistance lines. Although the bearish Diamond pattern is rarely formed, it can be used as a favorable trading opportunity to enter short positions.
How to trade using the bullish diamond
In the Diamond pattern, every rapid price increase is followed by a sharp decline. Once the upper trendline is broken and the price chart exits the pattern upward, a buy signal is generated. The price target for this pattern is equal to the distance between the highest and lowest points within the pattern. However, sometimes the price may exceed this target after the breakout.
Trading using the bullish diamond
In the Diamond pattern, every rapid price increase is followed by a sharp decline. After the upper trendline is broken and the price chart exits the pattern upward, a buy signal is triggered. The price target for this pattern is equal to the distance between the highest and lowest points within the pattern. However, there are instances where the price may exceed this target after the breakout.
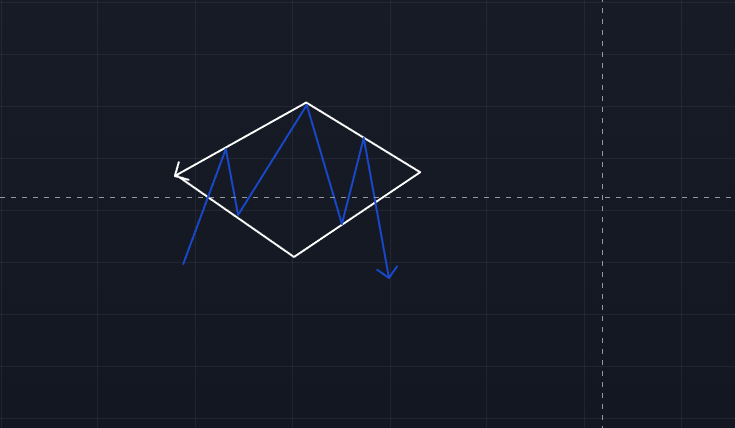
Trading using the bearish diamond
After the lower support line of the Diamond pattern is broken and the price chart exits the pattern downward, a sell signal is issued. In such situations, you can open a short position.
The price target after the pattern is broken to the downside is equal to the distance between the highest and lowest points within the pattern. However, in some cases, the price may exceed this target and reach higher price levels after the breakout.
Conclusion
In this article, we introduced the Diamond pattern or Rhombus pattern. As mentioned, the Diamond is a reversal pattern, and by identifying it on the price chart and using it at the right time, one can achieve significant profits. The bullish Diamond appears at the end of a downtrend, while the bearish Diamond forms at the end of an uptrend. This pattern is composed of four trendlines: the two upper trendlines act as resistance, and the two lower trendlines act as support.
After the bullish or bearish Diamond pattern is broken, the price chart will move upward or downward by the distance between the highest and lowest points within the pattern.