The world of trading is very large and is changing day by day. Finding a way to profit from the market has always been an issue that consumes traders. Some strategies meet traders’ needs for a while, but after some time, you see that the nature of the market changes and that strategy is no longer effective.
One of the patterns that consistently attracts the attention of traders is the Drop Base Rally (DBR) pattern. This pattern, characterized by its unique structure, can provide insights into potential trend reversals and create profitable trading opportunities for those who know how to identify it. Why can this pattern still be profitable? Because the structure of this pattern means that as long as the financial markets exist, this pattern also exists and cannot be ignored.
Your attention has certainly been drawn to this topic, and you want to know what this pattern is and how to use it. We will explore the DBR pattern in this article, including how to identify it, how to use it, and what key points to pay attention to when using this pattern. It will certainly be useful for anyone who has been in the market for any period of time, as mastery of the DBR pattern can significantly enhance your market analysis skills.
Reading Suggestion: Drop Base Drop Pattern
What is the Drop Base Rally Pattern?
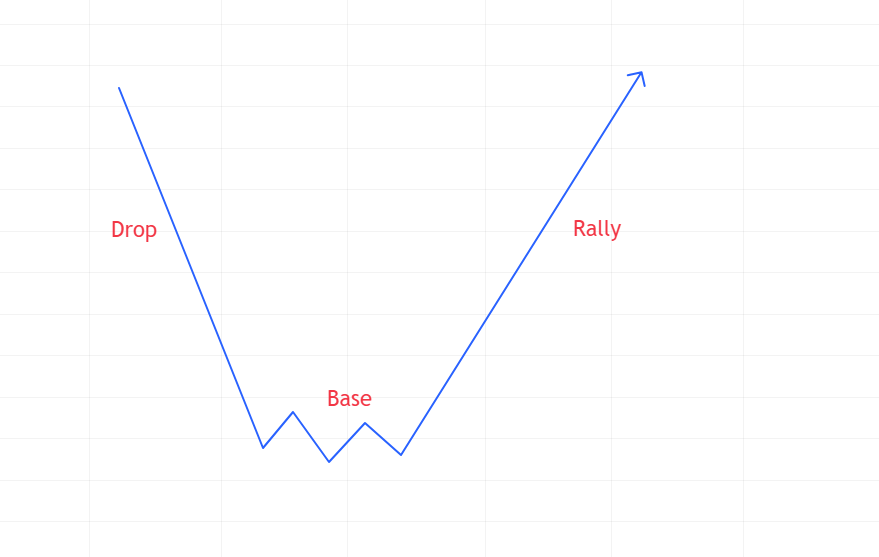
The Drop Base Rally pattern is one of the price action patterns that are still applicable in the market. This pattern is usually observed in financial markets where the price is in a downtrend. As its name suggests, this pattern consists of three phases: Drop, Base, and Rally. In the final phase, the Rally, it shifts from a downtrend to an uptrend, meaning that the Drop Base Rally pattern is a reversal pattern.
The Components of the Drop Base Rally
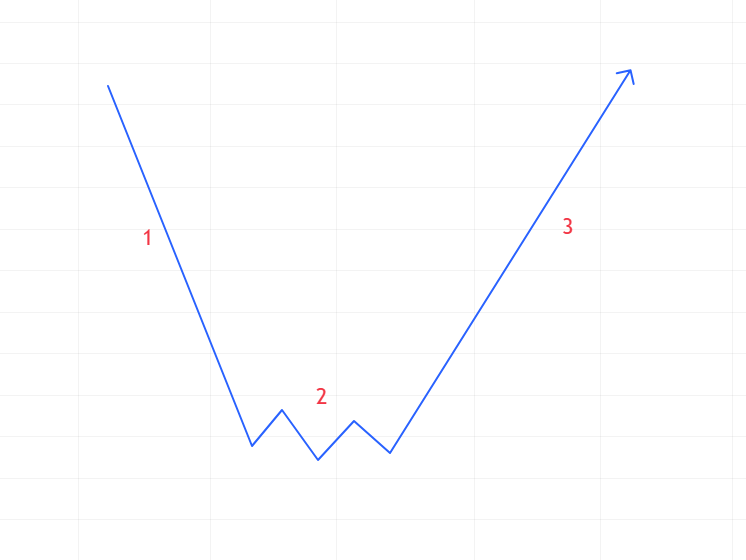
In the first phase, you need to become familiar with the components of the Drop Base Rally to be able to use it. Understanding the three components of the Drop Base Rally at the beginning can be very helpful for grasping this pattern and its movements.
- Drop: The first phase, the Drop, includes a significant price decrease. This decrease occurs due to strong selling pressure, where supply outstrips demand. Traders may observe long bearish candles during this phase, indicating aggressive selling.
- Base: After the Drop, the price enters a stabilization phase known as the Base. This phase is marked by a period of indecision in the market, where buyers and sellers are evaluating their positions. The Base can take various forms, including horizontal consolidation, triangles, or even a slight upward movement. Identifying this Base is crucial for traders because it signifies a potential reversal point.
- Rally: After the Base, the final phase is the Rally, where the price begins to rise significantly. This phase indicates that buyers have taken control, which is often driven by bullish sentiments or economic news. A well-formed Rally after the Drop and Base indicates strong buying interest.
The Psychology Behind the Drop Base Rally
To understand the psychology behind market movements, you can place yourself in the shoes of traders who are present in banks and large institutions. In the Drop Base Rally pattern, each phase represents changes in traders’ sentiments, and understanding this psychology provides important insights into the market’s direction. Therefore, comprehending the psychology of market participants is crucial for understanding the Drop Base Rally pattern.
During the Drop phase, fear becomes dominant as sellers control the market. Traders witnessing a rapid price decline may panic, leading to increased selling pressure that exacerbates the downward movement. This phase is characterized by heightened emotions, as traders react to market sentiments rather than logic.
As the price enters the Base phase, the emotional landscape shifts. Rapid selling begins to subside, and traders pause to reassess their positions. This stabilization phase illustrates a battle between buyers and sellers, where indecision prevails. Some traders may perceive that the price has been oversold, while others remain cautious, anticipating further declines.
Finally, when the price moves out of the Base and enters the Rally phase, emotions change dramatically. Optimism replaces fear as buyers seize the opportunity to enter the market. The Rally phase is marked by an increase in buying volume, indicating that demand has finally outstripped supply and suggesting a potential change in the direction of the market.
Identifying the Drop Base Rally on Charts
In the beginning, when you are not yet completely proficient in this pattern, finding it on charts may seem impossible and very difficult. However, we will teach you four steps to identify this pattern that will enable you to easily recognize the Drop Base Rally pattern. With practice and repetition, you will achieve mastery of this pattern. After that, simply looking at the chart will allow you to recognize this pattern and easily earn significant profits. These four steps are:
- Look for the initial drop: Start by observing a significant downward movement in price. This drop should be characterized by strong bearish candles, high volume, and a clear break of support levels.
- Pay attention to the formation of the base: After the drop, look for a stabilization phase. The base should consist of several candles that move horizontally or slightly upward. The key point here is the absence of selling pressure, indicating that buyers have started to enter the market. You may see smaller candles or a series of doji candles, reflecting indecision.
- Confirm the rally: Final confirmation occurs when the price breaks above the upper boundary of the base. The Rally phase often includes strong bullish candles accompanied by higher volume. This breakout indicates that buyers are in control, and the market is likely to continue on an upward path.
- Use additional indicators: To enhance your analysis, consider using additional technical indicators. Moving averages can act as dynamic support or resistance levels, while the Relative Strength Index (RSI) can help you assess whether an asset is in an overbought or oversold condition. These tools can provide further confirmation and reduce the risk of false signals.
Trading the Drop Base Rally Pattern
From the beginning of this article, we have been building up to a crucial point: how to trade using the Drop Base Rally (DBR) pattern profitably. Many people who are familiar with the DBR pattern face challenges at this stage, and after a few failures, they tend to give up. This approach is entirely wrong, and it’s essential not to succumb to discouragement. After all the hard work you’ve put into learning how to identify this pattern on charts and understanding its nature and the psychology behind it, you can achieve significant profits simply through practice and repetition. So don’t lose hope—continue to practice, as practice makes perfect.
Entry Points
Once you have fully identified the Drop Base Rally pattern, it’s time to consider entering a trade. A common entry point is to place a buy order after the price breaks above the base level, ideally following a confirmation of increased volume. This indicates that the rally is underway and that the asset is likely to continue rising.
Stop Loss Management
Effective risk management in trading is crucial, especially when using the Drop Base Rally pattern. To protect your capital in case the trade goes against you, place a stop-loss order just below the base level. This position ensures that you can limit potential losses.
Profit Target Setting
Determine your profit targets based on previous price movements and key resistance levels. The previous swing high before the drop can serve as a reference point for setting these targets. Additionally, consider using a risk-to-reward ratio of at least 1:2 to ensure that your potential profits outweigh your risks.
Adapting to Market Conditions
Market conditions can change rapidly, so be flexible and adjust your strategy accordingly if the asset shows signs of exhaustion or if fundamental changes are impacting the market. This adaptability will help you navigate unstable conditions more effectively.
Conclusion
The Drop Base Rally (DBR) pattern is one of the best reversal patterns in the market that still works effectively, allowing you to make significant profits. However, it’s important to note that during certain conditions, such as periods of high volatility or uncertainty, economic events, earnings reports, or geopolitical issues, the effectiveness of this pattern may become complicated. In such cases, it might not perform as expected. Additionally, false breakouts can occur, where the price briefly surpasses the base level and then retreats back down. These phenomena highlight the importance of using additional confirmation signals to strengthen your analysis.
Moreover, you should be aware of current events and broader market sentiments, keeping an eye on them to avoid potential losses. With a solid understanding of the components of the Drop Base Rally and the psychology behind the pattern, along with effective trading strategies and risk management, it’s unlikely that anyone could claim to have lost money without having made some mistakes along the way.
Like any trading strategy, the key to success with the Drop Base Rally is practice. Therefore, take the time to study this pattern in real market conditions and adjust your approach accordingly, so you can benefit from it over the long term. This commitment to continual learning and adapting will enhance your decision-making process and increase your chances of success in trading.
Incorporate the Drop Base Rally pattern into your trading toolkit, and you’ll be well-prepared to make informed decisions that align with market trends. Happy trading, and may your journey in the financial markets be prosperous!


Very good