Traders are always looking for new ways to maximize profits from financial markets like Forex and stocks, which leads to the emergence of new strategies and styles. Those who seek these methods are similar to ordinary people; the only difference is that these individuals are smart and meticulous, paying great attention to details. One of the tools that has been discovered and is now used in the RTM style is the ERC and NRC candles. These are a set of candles with a unique structure, and we can gain a lot of information about the market by using them. If you also want to enhance your knowledge about these candles and reveal more of the hidden secrets, be sure to stay with us until the end of this article, as we will examine the definitions, analytical methods, and their practical applications in our financial trading.
Candlestick charts originated from Japanese rice traders in the 18th century and have since become a core element of modern technical analysis. Each candle provides a visual representation of price movements for a specified time period, typically reflecting the opening, high, low, and closing prices. In the following sections of this article, you will become familiar with more information that we can derive from these candles.
Reading Suggestion: 4 Best Day Trading Strategies
Candle components
- Body: The thick part that shows the opening and closing prices and indicates the strength of the candle.
- Wicks (or shadows): Thin lines extending above and below the body that indicate the highest and lowest prices during the period and the weakness of the candle. (If a larger portion of the candle is occupied by the body, it is a strong candle, and if most of it is occupied by the shadow, it is a weak candle.)
- Color: Candles are typically color-coded – green indicates a bullish market where the closing price is higher than the opening price, while red indicates a bearish market.
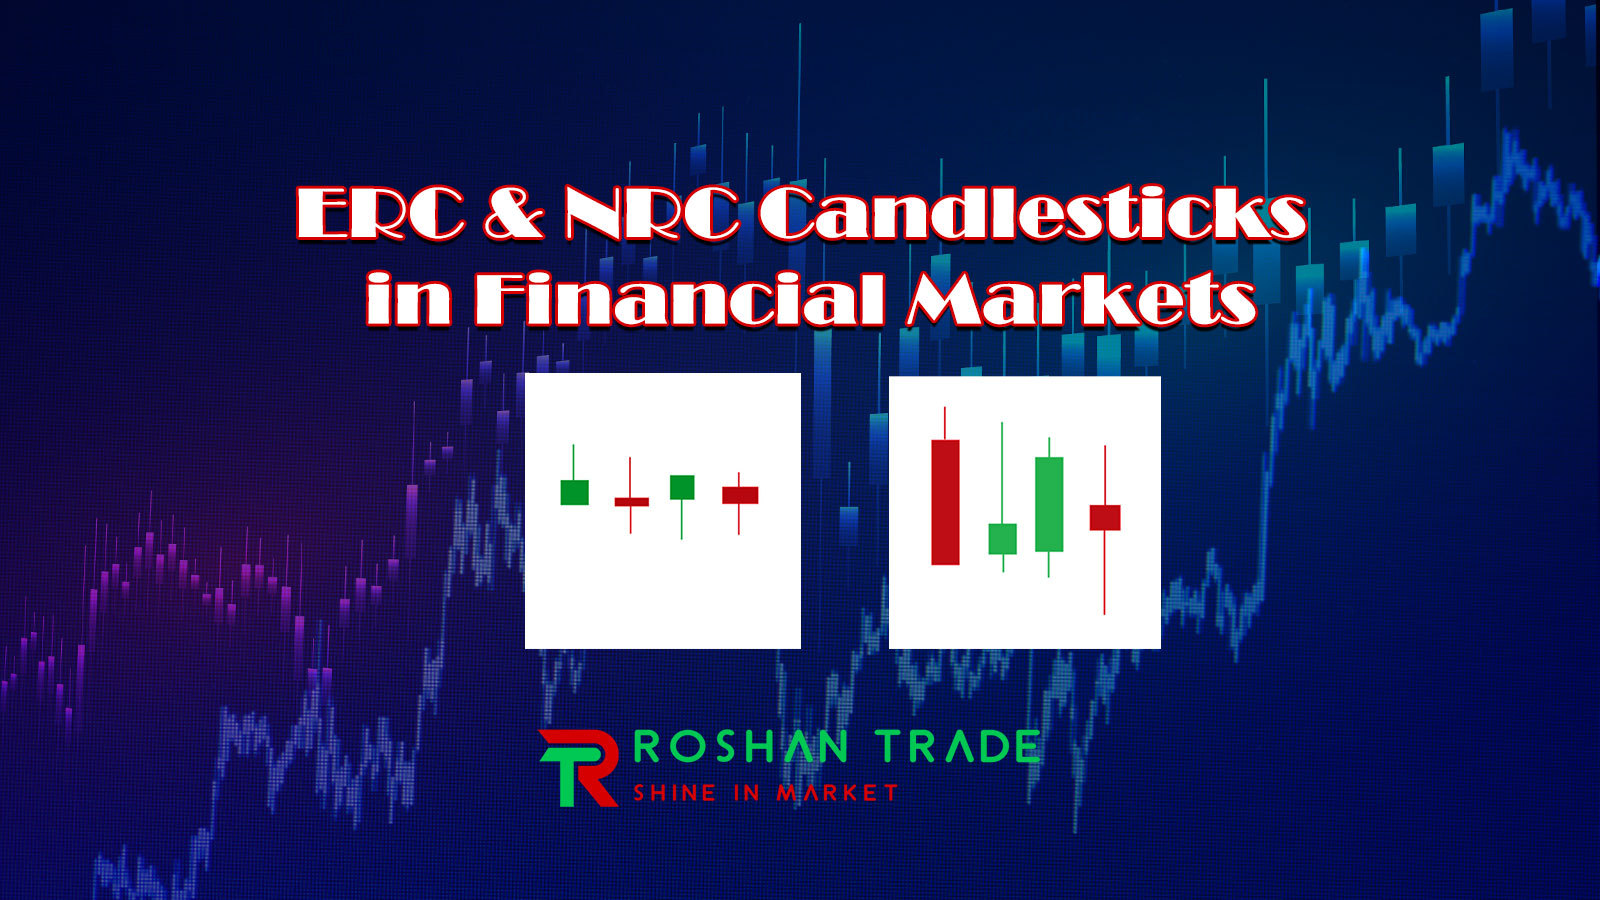
ERC and NRC Candlesticks: Definitions
It is true that ERC and NRC candles have similarities, but there are significant differences that we will examine later. However, we must first understand what these candles are and what they indicate.
What is an ERC Candle?
ERC, or Extended Range Candle, is a type of candle that focuses on the risks associated with executing trades in volatile market conditions. This candle is characterized by its notable wicks and may indicate sudden price movements that result in slippage or unexpected profits/losses. The shape of ERC candles is as shown in the image below, allowing you to easily identify them:
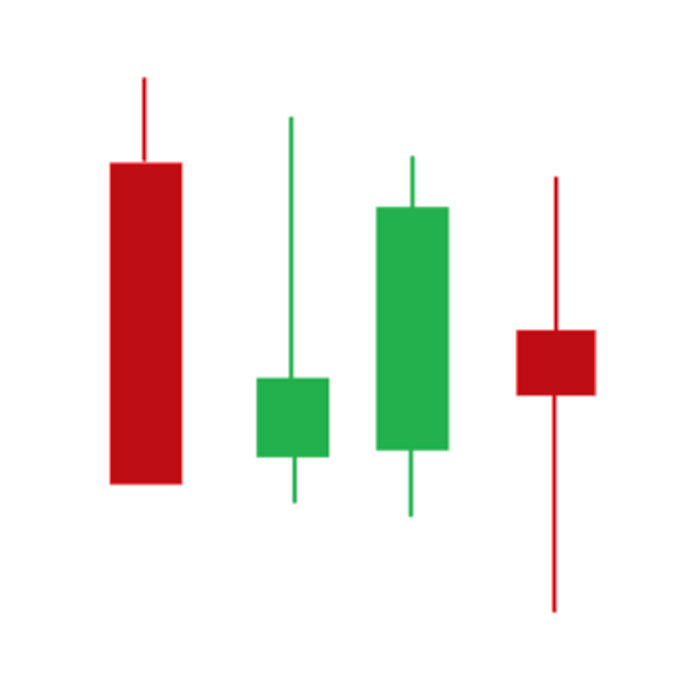
Key Features of ERC Candles:
The presence of long wicks in ERC candles indicates rapid price changes. These candles provide traders with insights into market sentiment based on price volatility. ERC candles help identify periods when executing trades may carry higher risks, alerting traders to approach the market with caution.
What is an NRC Candle?
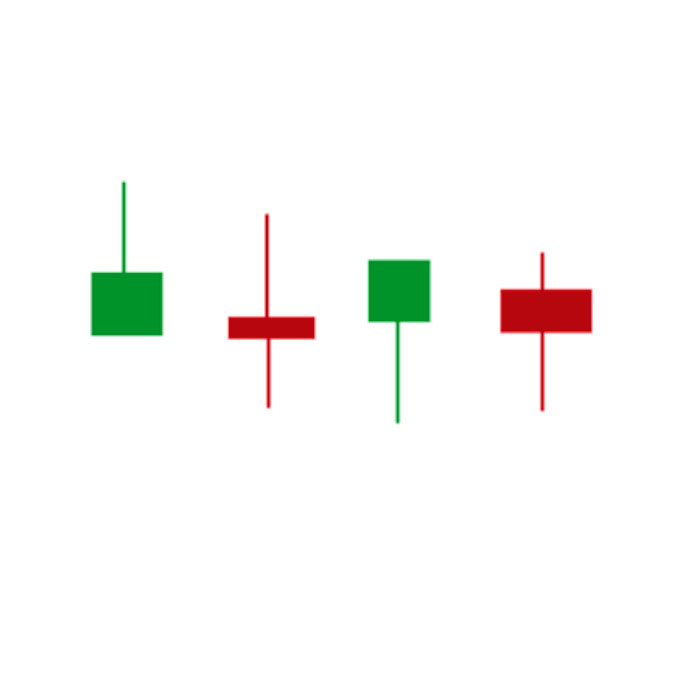
NRC, or Narrow Range Candle, is used to indicate periods with lower volatility and reduced execution risk. Traders familiar with NRC candles are aware of price stability and predictable movements, making them ideal for strategic investments rather than speculative trading.
Key Features of NRC Candles:
They are characterized by shorter wicks, indicating greater stability during the trading period. This smaller volatility suggests a more predictable movement, which can be beneficial for long-term investors. NRC candles assist traders in deciding when to enter or exit positions without fear of significant price declines.
When you want to use ERC and NRC candles in your trading, you must pay attention to the differences mentioned. If you do not understand these differences, you may make mistakes in your decision-making. Each type of candle helps traders make informed decisions based on their risk tolerance and market outlook, but how? We will discuss how to use these candles in your strategies.
Using ERC Candles in Your Strategy
Traders who benefit from market movements can use ERC candles to identify optimal entry and exit points. The notable wicks indicate moments of high volatility, presenting potential trading opportunities for short-term strategies (especially scalpers who love such markets). The long wicks associated with ERC candles can define strategic stop-loss positions, ensuring that traders protect their investments during unpredictable price fluctuations. This means you can place your stop-loss behind the latest low or high established by the ERC candles. Additionally, by monitoring ERC candles, traders can assess the appropriate amount of capital to risk on specific trades based on current market conditions.
Using NRC Candles for Stability
Generally, those who prefer NRC candles do not want the market to exhibit excessive price movements. It can be said that investors seeking stability and lower market noise may favor NRC candles. They indicate calmer market conditions, leading to strategic investments that rely less on immediate price action. For instance, they avoid economic news and trade currencies that are less affected by such news. The more stable price movements indicated by NRC candles can enhance investor confidence in their predictions and long-term strategies. By focusing on periods of lower volatility, traders can better control and normalize their risks, which is particularly beneficial for maintaining a steady long-term investment strategy.
| Candlestick Type | Body Color | Wick Length | Market Sentiment | Risk Level |
|---|---|---|---|---|
| ERC | Varies(Green and Red) | Long | High volatility | High execution risk |
| NRC | Varies(Green and Red) | Short | Low volatility | Low execution risk |
How to Analyze ERC and NRC Candles?
When you want to analyze ERC and NRC candles in the market, you should pay attention to whether this market is volatile or not. If it is volatile, you should proceed with the ERC candle analysis method, and if the volatility is low, you can use the NRC candle analysis.
In ERC candle analysis, look for repeating patterns to extract trading signals. Always consider external factors such as market news, earnings reports, or geopolitical events that may play a role in increasing volatility.
In NRC candle analysis, you can also use other technical analysis tools, such as moving averages, to confirm trends and inform buying or selling decisions. Identify significant support and resistance levels during periods with NRC candles to assess the likelihood of price reversal or continuation. Don’t forget to analyze NRC candles in different time frames (daily, weekly, etc.), as this can greatly help your view of the market.
Conclusion
If you also want to use candlestick patterns in your trades and are among those who know that understanding candle behavior can provide you with a lot of information about the market, this article may be very helpful for you. Understanding ERC and NRC candlestick patterns can be your next step toward success in financial markets. Each type has unique characteristics that reflect market dynamics and allow traders to adapt their strategies accordingly. By analyzing these candlestick patterns, investors can improve their trading performance and make informed decisions that align with their risk tolerance and investment goals.