If you’re new to trading, investing, or data analysis, understanding and using indicators can seem overwhelming. However, indicators are powerful tools that can help you make informed decisions by providing insights into market trends, performance, and potential opportunities. This article will introduce you to the 5 best indicators for beginners, explain how they work, and provide tips on how to use them effectively.
Reading Suggestion: Best Indicators for Weekly Charts
What Are Indicators?
Indicators are tools used to analyze data and identify patterns, trends, or potential opportunities. In trading and investing, indicators are often used to predict price movements, while in other fields like business or project management, they help track performance and progress.
Indicators can be technical (used in trading to analyze price movements) or fundamental (used to evaluate the financial health of a company or economy). For beginners, it’s best to start with simple, easy-to-understand indicators that provide clear signals.
Why Are Indicators Important for Beginners?
- Simplify Decision Making: Indicators help beginners make sense of complex data by providing clear, actionable insights.
- Identify Trends: Indicators can help you spot trends in the market or performance, making it easier to predict future movements.
- Reduce Risk: By providing signals about potential price changes or performance issues, indicators can help beginners minimize risk.
- Build Confidence: Learning to use indicators effectively can boost your confidence as you start your journey in trading, investing, or data analysis.
The Best Indicators for Beginners
Now let’s get down to business and get acquainted with the 5 best indicators for beginners. Remember that you cannot rely on indicators alone to make trades, and you need to strengthen your strategy and technical analysis so that you can maintain your account in the world’s major markets such as Forex and not lose your capital.
1. Moving Averages (MA)
If you are new to trading, you may not be able to identify the trend correctly yet. With the MA indicator, you can see the average price of an asset over a certain period. It smooths out price fluctuations to help you identify trends. There are two types of moving averages: Simple Moving Average (SMA): the average price over a certain period, and Exponential Moving Average (EMA): it gives more weight to recent prices and reacts to changes.
You can use this indicator to place your trades and also identify the trend. If the price is above the moving average, it is an uptrend. If it is below, it is a downtrend. When the short-term moving average crosses the long-term average, it is a buy signal. When it crosses below, it is a sell signal.
2. Relative Strength Index (RSI)
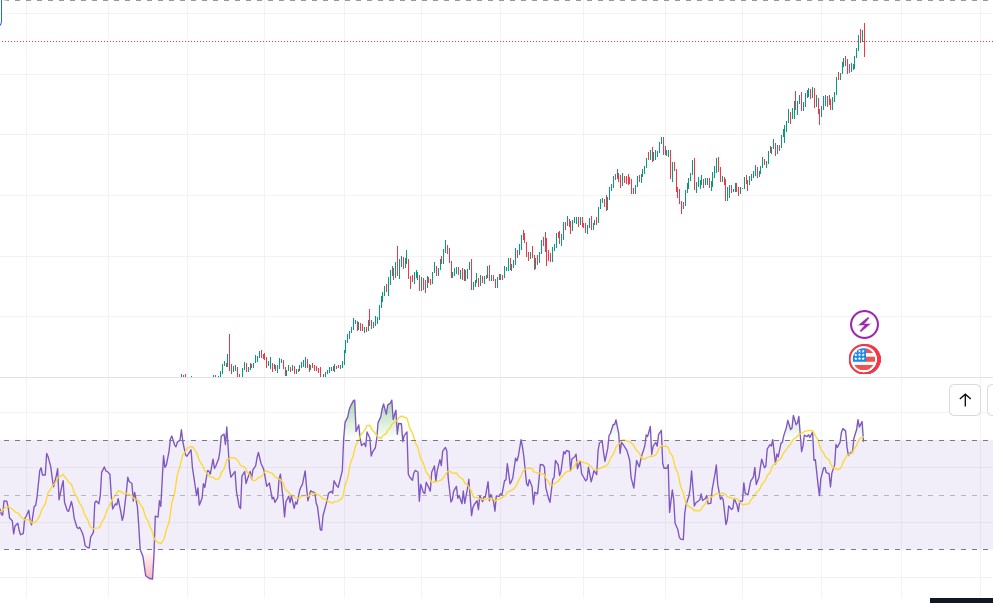
If you want to know the speed and changes in price movements in the market but you have not yet reached that experience, you can use the RSI indicator. This indicator is a momentum oscillator that measures the speed and changes in price movements and varies from 0 to 100. After you install the RSI on the chart, you need to assess the conditions.
The buying and selling conditions are as follows:
An RSI above 70 indicates overbought conditions (a potential sell signal). An RSI below 30 indicates oversold conditions (a potential buy signal).
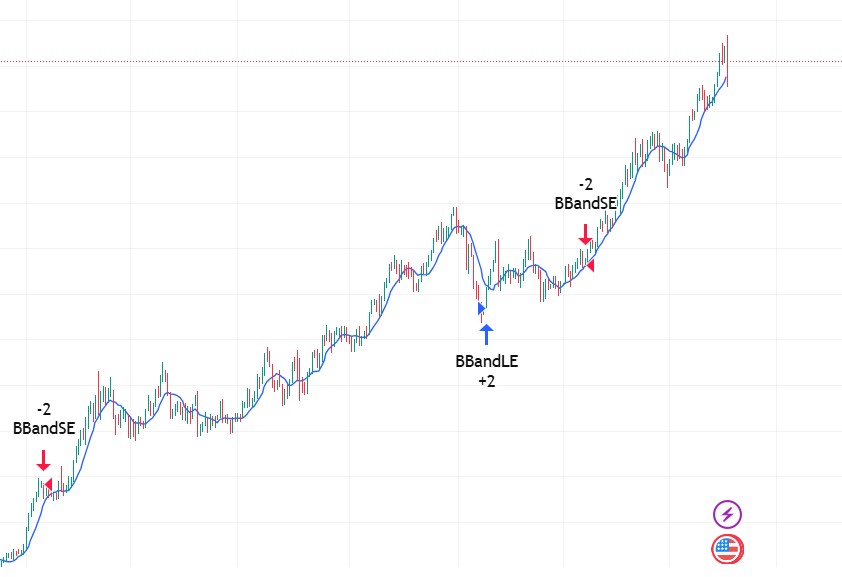
3. Bollinger Bands
Want to measure volatility? Bollinger Bands are made up of a moving average and two standard deviation lines above and below it, and they help you measure volatility. There are a few things you need to know to use this indicator. First, when the bands are wide, volatility is increasing, and when they are narrow, volatility is decreasing. To place your trades, you need to look at the chart, if the price is close to the upper band, it may indicate buying conditions, while if the price is close to the lower band, it may indicate selling conditions.
4. MACD (Moving Average Convergence Divergence)
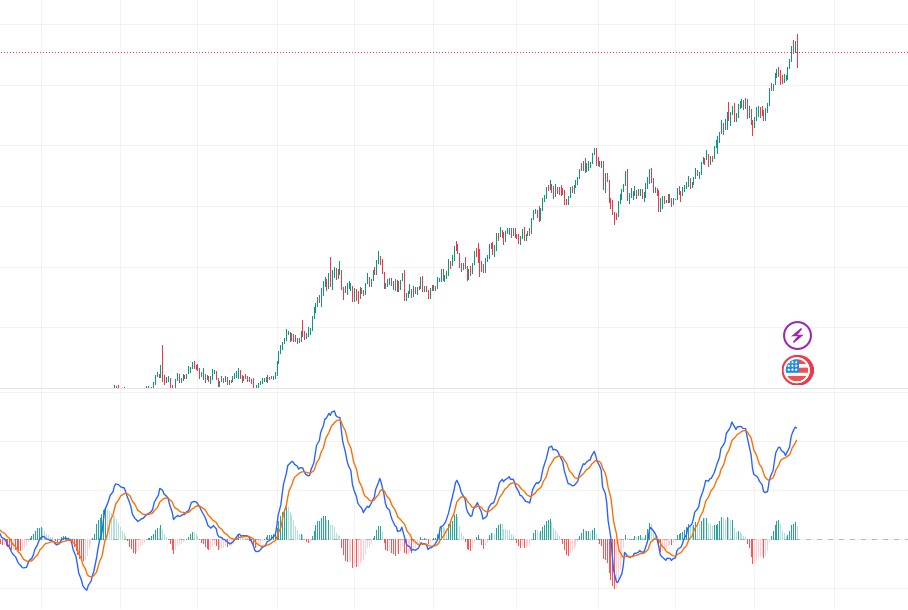
Another indicator that you can use when you are just starting out in the world of trading is MACD. This indicator is a trend-following moving average that shows the relationship between two moving averages of an asset’s price. When the MACD line crosses above the signal line, it is a buy signal.
When it crosses below, it is a sell signal, and if the MACD moves in the opposite direction of the price, it can be a sign of a possible reversal. So be careful to manage your trades using an indicator like this.
5. Volume
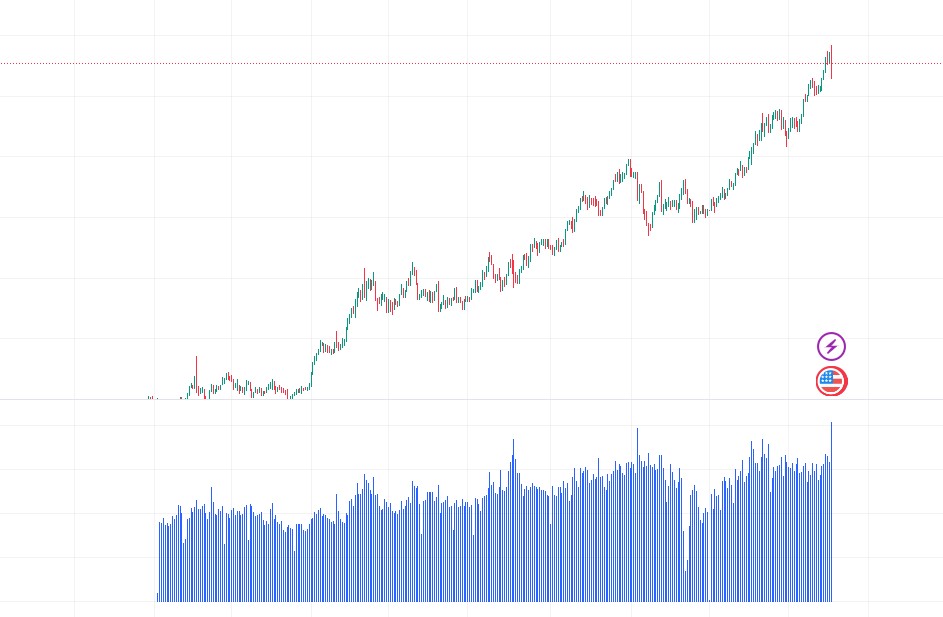
Volume is one of the most important indicators you need to survive in this market. It measures the number of shares or contracts traded in a security or market, and you can use it to see where there is a lot of trading. High volume can confirm the strength of a trend. Low volume may indicate weak movement, and a sudden increase in volume during a price breakout can be a sign of strong movement.
Tips for Beginners Using Indicators
- Start Simple: Focus on one or two indicators at first. Overloading yourself with too many indicators can lead to confusion.
- Combine Indicators: Use complementary indicators to confirm signals. For example, use the RSI with moving averages to confirm trends and overbought/oversold conditions.
- Practice: Use demo accounts or backtesting to practice using indicators without risking real money.
- Understand the Limitations: No indicator is 100% accurate. Use them as tools to guide your decisions, not as guarantees.
- Stay Consistent: Stick to a strategy and avoid constantly switching indicators. Consistency is key to mastering their use.
Common Mistakes Beginners Make with Indicators
- Overcomplicating: Using too many indicators can lead to conflicting signals and confusion.
- Ignoring the Big Picture: Indicators are most effective when used in conjunction with broader market analysis.
- Chasing Signals: Avoid the temptation to act on every signal. Focus on high-probability setups.
- Not Backtesting: Always test your strategy on historical data before applying it to live trading or investing.
FAQs About Indicators for Beginners
1. What is the easiest indicator for beginners?
The moving average is one of the easiest indicators for beginners because it clearly shows trends and is simple to interpret.
2. Can I use multiple indicators at once?
Yes, but it’s best to start with one or two indicators and combine them in a way that provides complementary signals (e.g., using RSI with moving averages).
3. Do indicators work for all markets?
Indicators can be used in various markets (stocks, forex, crypto), but their effectiveness may vary depending on market conditions and volatility.
4. How do I know which indicator to use?
Choose indicators based on your goals. For example, use moving averages for trend identification and RSI for overbought/oversold conditions.
5. Are indicators reliable?
Indicators are tools that provide insights, but they are not 100% accurate. Always use them in conjunction with other analysis methods.
By starting with these best indicators for beginners, you’ll be well on your way to making informed decisions in trading, investing, or data analysis. Remember to practice, stay consistent, and keep learning as you build your skills!