In a world where financial markets have made earning money very simple, you also need to know how to trade like professionals. For better and more informed decisions, you must understand where and what to do. Among the various tools and patterns that traders use, today we want to talk about Rally Base Drop.
This pattern is a strong signal for traders looking to invest in downtrends. It is one of the best tools you can learn because it exists in all financial markets worldwide and, unlike most classic patterns, it really works. Even in financial markets like crypto, which have emerged recently, you can still find the RBD pattern. This indicates the strength of this effective pattern. If you are also interested in learning more about this pattern, then you have come to the right place. By the end of this article, you will know what RBD is, how to identify it, and what practical strategies are effective for trading this pattern.
Reading Suggestion: DBD Pattern
Understanding the Rally Base Drop (RBD) Pattern
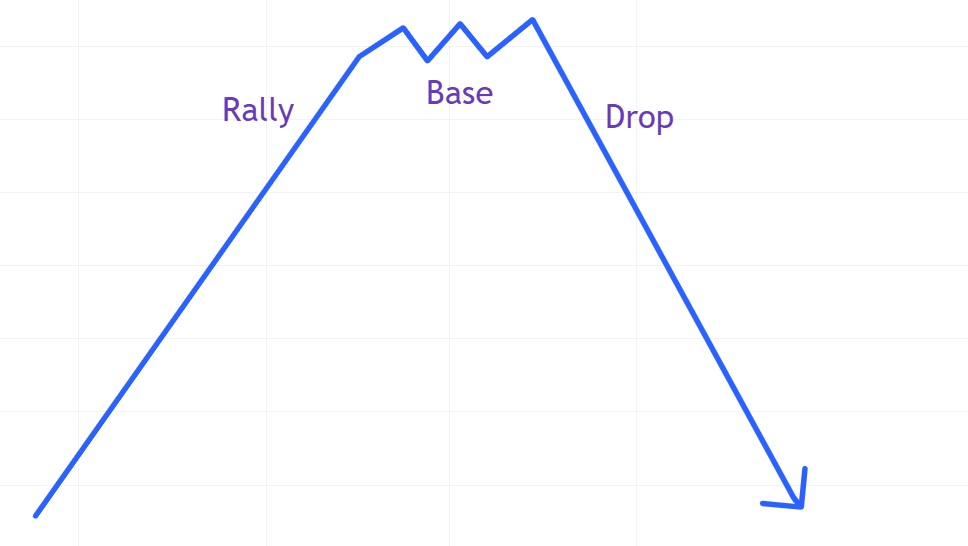
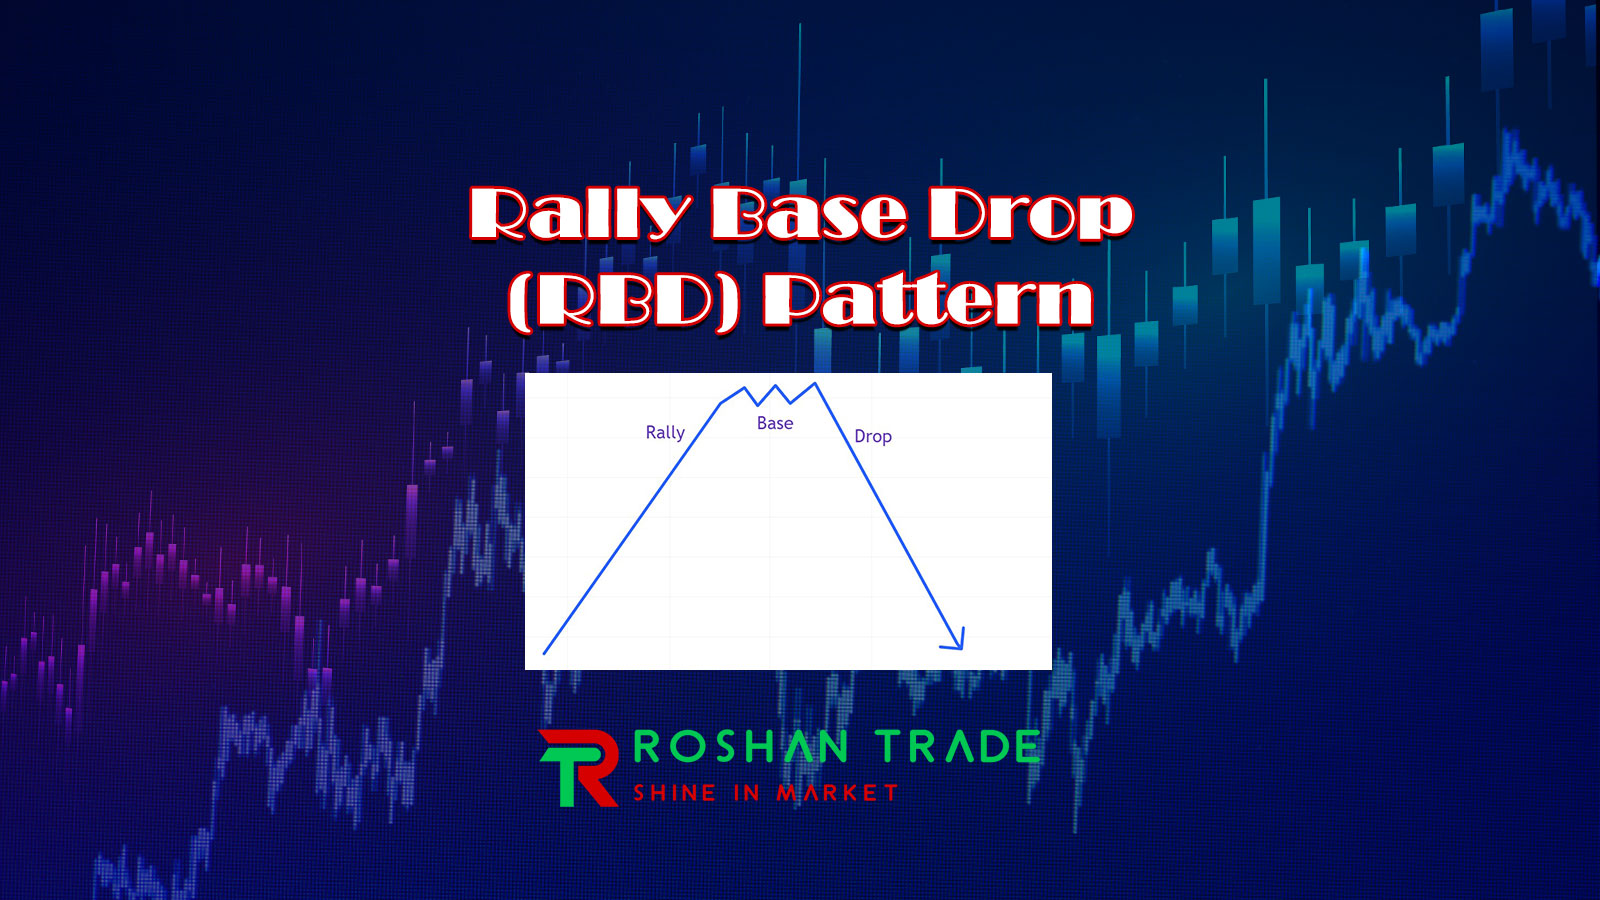
Alright, to start with, let’s see what RBD actually is. RBD is essentially a bearish pattern consisting of three distinct stages: a strong upward move (rally), a consolidation period (base), and a decisive downward move (drop). Recognizing these stages will help you get an overall perspective on what we want to teach you in this article, and it will enable you to better understand the concepts we discuss later. Overall, to use something effectively, you must first become familiar with it, so understanding RBD will also help you use this pattern better than anyone, even professionals.
As mentioned, RBD consists of three components: rally, base, and drop. Each of these stages can play a very important role in your decision-making and, if you’re not careful, may mislead you.
- Rally: The first stage involves a sudden and significant price increase, which usually indicates strong buying pressure. This increase signifies a change in sentiment as traders begin accumulating a specific asset. The upward movement prepares the ground for the next stage.
- Base: After the rally, a price consolidation occurs, where the asset trades within a defined range. This base acts as a zone of interest for traders and reveals potential levels of supply and demand. The longer this base endures, the more significant it becomes, indicating that traders are either accumulating positions or waiting for a breakout.
- Drop: The final stage is where the price falls below the support level of the base, signaling the start of a new downtrend. This drop is often accompanied by an increase in volume, confirming the bearish sentiment. A successful drop indicates a significant change in market dynamics, showing that sellers now hold the control.
Why is trading the RBD pattern important?
The RBD pattern can be one of the most effective patterns you have encountered. This pattern signifies one of the high win-rate trading starters. Firstly, it reduces your risk by allowing you to trade with the trend, as it identifies bearish sentiments after an upward increase. Additionally, the nature of the base defines levels for entry, stop-loss, and profit, helping you manage risk effectively. By recognizing and trading the RBD pattern, you can improve your win ratio and enhance your overall trading performance.
Identifying the RBD pattern on a chart is not too difficult, but it may be somewhat challenging for beginners. Recognizing it requires careful observation and understanding of price action, so pay attention and focus on the chart. Once you are focused, the only thing you need to do is follow these three steps to significantly reduce your risk.
- Step 1: Look for a strong rally
To identify the RBD pattern, start by searching for a significant and rapid price increase. Ideally, this rally should surpass previous resistance levels, indicating strong buying interest. At this stage, pay attention to the volume. Higher volume usually indicates that the rally is credible and likely to continue in the short term.
- Step 2: Analyze the base structure
After the rally, evaluate the price action for consolidation or base formation. This base can take various forms, such as a rectangular range, triangle, or flag pattern. The key to identifying a solid base is its duration. A longer base generally indicates that significant market participants are accumulating shares or waiting for the trend to grow.
- Step 3: Watch for the breakdown
The final stage of the RBD pattern involves a breakdown below the lower edge of the base, which acts as a crucial support level. A successful RBD setup typically shows increased volume during the breakdown, reinforcing the bearish sentiment and pushing the price lower. At this stage, you should also look for bearish candlestick patterns like a sinking candle or a shooting star as additional confirmation.
How to Trade the RBD Pattern like a Pro?
Now that we know how to identify the RBD pattern and understand what it is, we can develop a solid strategy for utilizing this exciting pattern for ourselves. In the following sections, we will discuss entry points, stop-loss levels, profit targets, and additional risk management techniques that, if followed, can help you preserve your capital in financial markets and achieve compound profits with practice and repetition.
- 1. Entry Strategy
The most appropriate moment to enter a trade is when the price decisively breaks below the support level that forms the base. A good entry point is set just below this support level to take the next step lower. Confirm this setup by making sure that trading volume is decreasing, providing further confidence that the downtrend is real.
- 2. Stop Loss Placement
To protect your capital, it is essential to implement an effective stop loss strategy. A good rule of thumb is to place your stop loss just above the highest point in the base. This placement ensures that you will be exited if the price reverses and negates the bearish pattern, allowing you to minimize potential losses.
- 3. Profit Targets
A profit target strategy can greatly increase the effectiveness of your trading. You can set a profit target by measuring the height of the rally (the distance from the lowest base point to the highest rally point) and then plotting that distance from the breakout point downwards. This method allows you to set a realistic target based on the asset’s past price performance.
Alternatively, you can use Fibonacci retracement levels to identify potential areas of reversal where the asset may encounter support. To further optimize your profit targets, use levels such as the 1.618 extension.
- 4. Risk Management
Implementing a risk management strategy is crucial to achieving long-term trading success. Limit your risk to a maximum of 1-2% of your trading capital per trade. By following strict risk management principles, you can trade with peace of mind, knowing that a series of losing trades will not significantly damage your portfolio.
Conclusion
In this article, you learned that the RBD pattern is a very powerful pattern for trading in any market. You can achieve highly profitable entries using this pattern, something that is difficult to find with other patterns in the market. By understanding its components, identifying the pattern, and implementing suitable trading strategies, you can maximize your chances of success in today’s dynamic market environments. Let’s summarize some key points you learned, along with a few important reminders.
The RBD pattern consists of a strong rally followed by a consolidation base and concludes with a drop or breakdown.
- Confirm entry points with increased volume and corroborating price action.
- Set a stop-loss to protect your capital.
Remember to also evaluate the RBD pattern within the context of market trends on larger timeframes, as many traders incur significant losses due to negligence in checking higher timeframes. Additionally, trading without assessing volume increases can lead to false signals, so be sure to examine trading volume using volume profiles before entering a trade.
By adhering to these guidelines and continuously practicing, you can improve your trading outcomes and work towards achieving compound profits. Happy trading!
Now that you’re equipped with the know-how of the RBD pattern, it’s time to scout your charts for potential setups, refine your strategies, and take your trading to the next level. Good luck!


Awesome