Nowadays, many traders are trying to find new ways to earn profits from financial markets, but smart individuals are seeking to improve their current strategies which they have spent a lot of time developing and discovering. Both those looking for new methods and those wanting to improve their strategy day by day will sooner or later come to the conclusion that the RSI and MACD indicators are the best way to do this. These two indicators allow traders to identify potential entry and exit points and make informed decisions regarding their trades. In this article, we intend to examine two indicators that are among the most commonly used indicators of the year, understand their differences, and use each in the correct places.
Understanding the RSI and MACD Indicators
Before comparing RSI and MACD, we need to understand what each of these indicators signifies and how they operate in the world of technical analysis, so that we can evaluate their strengths and weaknesses and assess their effectiveness in the financial markets.
Relative Strength Index (RSI)
The Relative Strength Index, developed by J. Welles Wilder in 1978, is a momentum oscillator that measures the speed and change of price movements. The RSI ranges from 0 to 100 and is commonly used to identify overbought or oversold conditions in an asset. The basic formula for calculating the RSI is as follows:
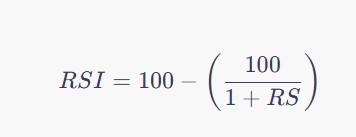
Where (RS) (Relative Strength) is the average closing prices of (x) days of upward movements divided by the average closing prices of (x) days of downward movements. Typically, a 14-day period is used for (x).
- How to Use the RSI Indicator:
- An RSI above 70 generally indicates that a currency is overbought, suggesting that a price correction may be on the way. Conversely, an RSI below 30 indicates oversold conditions, implying that a price increase may occur. In summary, the RSI shows us the strength of buyers and sellers. The stronger side causes the price to move more in its direction. (If buyers are stronger, the price rises, and if sellers are stronger, the price falls.)
Moving Average Convergence Divergence (MACD)
The Moving Average Convergence Divergence (MACD), created by Gerald Appel in the late 1970s, is a trend-following momentum indicator that shows the relationship between two moving averages of a security’s price. The formula for calculating the MACD is:

Where (EMA) stands for Exponential Moving Average, which gives more weight to recent prices. A signal line, which is a 9-day EMA of the MACD itself, is added to the MACD line.
- How to Use the MACD Indicator:
- A bullish crossover occurs when the MACD line crosses above the signal line, indicating bullish momentum, and conversely, a bearish crossover happens when the MACD line crosses below the signal line, indicating bearish momentum.
To better understand how these indicators differ and how they complement each other, we can present their key characteristics in a comparison table:
| Feature | RSI | MACD |
|---|---|---|
| Calculation | Based on price momentum | Difference between two EMAs |
| Range | 0 to 100 | No fixed range; fluctuates around zero |
| Purpose | Identifies overbought or oversold conditions | Shows trend direction and momentum |
| Signals | Overbought (>70), Oversold (<30) | Crossover leads to buy/sell signals |
| Best Used In | Sideways or range-bound markets | Trending markets |
| Lagging or Leading | Can provide early signals | Typically lags due to moving averages |
From this comparison table, we can see that while RSI focuses on identifying potential market extremes (overbought or oversold), MACD provides insights into the overall trend and directional momentum.
Advantages and Limitations of RSI
The RSI can be said to be very simple. Its visualization is quite easy for users of any age and allows traders to easily see overbought and oversold conditions at a glance. Additionally, the RSI can highlight potential price reversals through divergences, where the price moves in one direction while the RSI moves in the opposite direction. However, in strong trending markets, the RSI may remain in overbought or oversold regions for extended periods, leading to potential false signals. It also does not provide information on the strength of the main trend, potentially guiding traders towards weak entry or exit points.
Advantages and Limitations of MACD
The MACD, like the RSI, is used to confirm trends, providing information on the strength and direction of a trend, helping traders make informed decisions in aligned market conditions. The crossing of the MACD line and the signal line is visually clear and can act as strong buy or sell signals when confirmed by other indicators.
The characteristic of these signals is that they are very simple and easy to understand, requiring little knowledge to interpret. On the other hand, if we discuss the limitations of the MACD, it should be noted that since the MACD is based on moving averages, there is often a lag in the generated signals, potentially leading to missed opportunities in fast-paced markets. Additionally, in unstable markets, the MACD can produce multiple false crossover signals, which can result in erratic trading decisions.
Combining RSI and MACD in Trading Strategies
Although both the RSI and MACD can be powerful on their own, combining these two indicators can work like a bomb and greatly assist traders in their decision-making. This idea has certainly caught your interest. By doing so, you can minimize the limitations each has and reduce the chances of making mistakes. To combine these two important indicators in your strategy, you can follow these steps:
- Use the MACD to identify the dominant trend. If the MACD line is above the signal line, the market is in a bullish phase; if it’s below, it is bearish.
- While identifying the trend, check the RSI values. In a bullish trend, look for oversold conditions (RSI below 30) as a potential entry point, while in a bearish trend, look for overbought signals (RSI above 70) for short-selling opportunities.
- Use both indicators to confirm signals. For example, if the MACD creates a bullish crossover, check if the RSI is in oversold conditions or is approaching that to strengthen your confidence in the buy signal.
Conclusion
The art of trading is akin to navigating a vast ocean—having the right tools can make a significant difference. The Relative Strength Index (RSI) and Moving Average Convergence Divergence (MACD) are essential indicators that can enhance your technical analysis skills. Understanding the strengths and weaknesses of each indicator and knowing when to use them together can pave the way for better decision-making and potentially successful trades.
By integrating these indicators into a cohesive trading strategy and adhering to proper risk management principles, traders can elevate their performance and navigate the complexities of the market with greater confidence.