TradingView is one of the most popular analytical platforms in financial markets, providing various tools and indicators for traders. If you’re looking to use professional indicators, in this article, we will introduce you to free indicators available for TradingView, so stay with us.
Reaading suggestion: Best Indicators for Day Trading in 2025
Top Free Indicators on TradingView
Here are some of the best free indicators available on TradingView:
1.Relative Strength Index (RSI):
The RSI is one of the traditional and popular indicators used to identify overbought and oversold market conditions. It fluctuates between 0 and 100 and helps analysts identify potential entry or exit points in the market. This indicator measures the strength and speed of price movements. Trading signals using this free TradingView indicator are:
- Buy Signal: When the price is below 30, it indicates oversold conditions, suggesting that the price may increase in the future.
- Sell Signal: When the price is above 70, it indicates overbought conditions, suggesting that the price may decrease in the future. You can learn how to use this indicator and combine it with other tools by studying the MACD indicator in TradingView.
2.Moving Average Convergence Divergence (MACD):
MACD is one of the best free indicators on TradingView, functioning as a momentum indicator that helps identify changes in strength, direction, momentum, and duration of a trend. It is particularly effective in trending markets. Trading with this indicator involves the following:
- Buy Signal: A buy signal is generated when the MACD line crosses the signal line from below and moves upward.
- Sell Signal: A sell signal occurs when the MACD line crosses the signal line from above and moves downward. If you are looking for other momentum indicators, you can read the Momentum Indicator article on Mr. Trade’s website.
3.Volume Weighted Average Price (VWAP):
VWAP is another top free indicator on TradingView that calculates the average price of an asset based on trading volume. It is one of the critical tools for day traders in stock and cryptocurrency markets, as described below:
- Buy Signal: When the price is above VWAP, it indicates a bullish trend.
- Sell Signal: If the price is below VWAP, it indicates bearish sentiment in the market. It’s worth mentioning that this indicator can act as dynamic support and resistance, providing suitable entry and exit points for traders.
4.Supply and Demand Indicator:
Supply and demand are the primary forces driving price movements in the market. The Supply and Demand indicator on TradingView helps you identify areas where buying and selling pressure is high. After activating this indicator, different zones will be displayed:
- Demand Zones: Areas where strong buyers have entered the market, pushing prices up.
- Supply Zones: Areas where sellers have taken control, driving prices down.
5.Ichimoku Indicator:
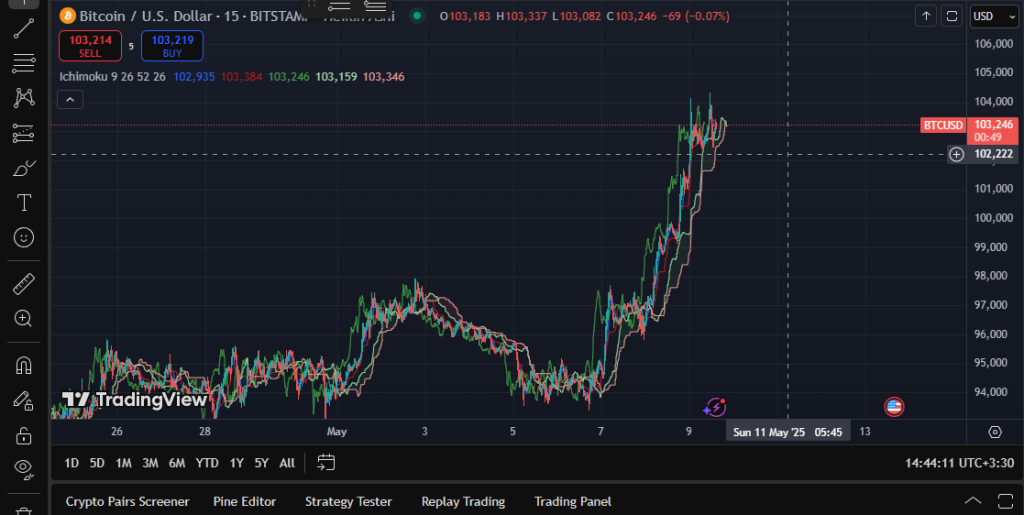
The Ichimoku indicator is a powerful, complex tool that presents a lot of information in a simple visual format. It can help analysts identify trends, support and resistance, and momentum signals. Among the various components of Ichimoku, you can use the cloud as a free indicator on TradingView. Here’s how to trade using the Ichimoku cloud:
- Buy Signal: If the price moves above the cloud, it indicates a bullish trend.
- Sell Signal: If the price falls below the cloud, it indicates a bearish trend.
6.Support & Resistance Indicator:
Another great free indicator on TradingView is the Support & Resistance indicator, which automatically identifies key market levels based on previous highs and lows. If you activate this indicator, it displays different price sections:
- Support: This supportive area is where a downtrend may halt because buyers are stronger.
- Resistance: This resistance area serves as a level where an uptrend may stop due to increased selling pressure.
7.Average True Range (ATR):
The ATR indicator measures market volatility and can help you determine reasonable profit and loss targets. This indicator shows how much the price moves on average over a specified period. You can use ATR to set profit and loss limits. If ATR is high, it indicates high volatility, so you can set a larger stop loss. Conversely, if ATR is low, it implies a calm market, requiring a smaller stop loss.
8.RSI+MACD Divergence Indicator:
If you are looking for a combined indicator that evaluates both trend momentum and trading signals, the RSI+MACD Divergence indicator is an excellent option. It combines RSI for measuring buying and selling strength with MACD for detecting bullish and bearish crossovers. The RSI+MACD Divergence indicator also smartly displays buy and sell points, as well as divergences. If you wish to explore professional paid indicators, you can read about the best paid indicators on Mr. Trade’s website.
9.Volume Profile Indicator:
The Volume Profile indicator is an advanced tool for analyzing market structure, showing the price range where trading volume is concentrated. To use this indicator, specify a trend, and the following price areas will be displayed:
- Value Area Low (VAL): The lowest range where the majority of trading volume occurred.
- Value Area High (VAH): The highest range with significant trading volume.
- Point of Control (POC): The price level with the most transaction volume, usually acting as a market equilibrium point.
Comparison of the Best Free TradingView Indicators
Here’s a comparison table of the free TradingView indicators:
| Indicator | Type | Advantages | Disadvantages |
|---|---|---|---|
| RSI | Momentum | Detects overbought/oversold | False signals in trending markets |
| MACD | Momentum | Trend change detection | Delay in signals |
| VWAP | Trend/Support and Resistance | Ideal for day trading | Less effective in low liquidity |
| Supply and Demand | Combined (Trend, Support, Resistance) | Displays multiple insights at once | High complexity, requires mastery |
| Support & Resistance | Support and Resistance | Automatically identifies key levels | Risk of false breakouts |
| ATR | Volatility Indicator | Helps set logical profit and loss | Doesn’t provide direct buy/sell signals |
| RSI+MACD Divergence | Combined (Momentum, Divergence) | Combines RSI and MACD for stronger signals | Increased complexity |
| Volume Profile | Volume/Market Structure | Identifies market equilibrium points | Requires detailed analysis and experience |
Conclusion
In this article, we introduced various free indicators for TradingView and explained how you can use them to receive buy and sell signals. It’s important to note that by combining free TradingView indicators, you can use them more effectively to optimize your trading strategy.