What is the concept of engulf in RTM?
In the RTM (Read The Market) style, traders need some form of proper confirmation to enter trades. An engulfing candle that forms at key levels can serve as a suitable confirmation for entering or exiting trades and can significantly impact your trading. These candles, with larger bodies or higher ATR (Average True Range) compared to other candles, can reduce the trader’s risk when entering trades.
In RTM, traders identify specific price levels, and when the price reaches these levels, they often observe the formation of an engulfing candle that covers at least one or two previous candles. In such cases, the entry risk is reduced. Additionally, these candles are used to confirm breakouts at key levels, providing stronger validation for the breakout.
Later in the article, we will explore different types of engulfing patterns, so stay tuned with Roshan Trade.
Types of Engulfed in RTM
Traders must understand the different types of engulfing patterns in RTM to optimize their use in financial markets and make well-informed trading decisions at the best opportunities. Below, we explore the two main types of engulfing patterns in RTM:
- Bullish Engulfing
- Bearish Engulfing
To effectively use engulfing patterns in RTM, you must apply the appropriate type based on the market trend (Market Trend). In the following sections, we will provide a detailed, visual guide on each of these patterns to help you master their application.
Bullish Engulf
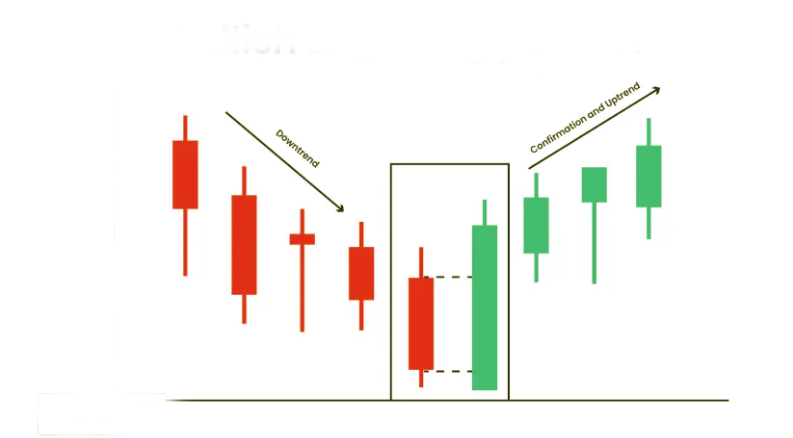
After conducting a full analysis and identifying key levels in the RTM style, you can use the bullish engulfing pattern in your trades. Note that this type of engulfing is specifically applied in bullish market structures. For example, when you are in an uptrend and have defined a support level according to the RTM methodology, wait for the price to reach these levels and then look for the formation of an engulfing candle.
This candle should fully cover one or two preceding candles and have a large body. In this way, the engulfing can serve as a strong confirmation signal for entering a trade in the RTM style.
The bullish engulfing pattern in RTM is not only used at support levels but also for breaking resistance levels. If the price penetrates a resistance level with a large bullish engulfing candle and closes at least 50% above that level, it can be concluded that the resistance is broken, and a new bullish structure has formed.
When using engulfing patterns in RTM, always wait for the candle to fully close on your specified timeframe. Market makers may increase selling pressure in the final moments, preventing the engulfing pattern from forming.
Bearish Engulf
The bearish engulfing pattern acts as the exact opposite of the bullish engulfing. Traders can identify valid resistance levels in RTM (Real-Time Market) and enter short positions when the price reacts to these levels alongside the engulfing candle. For example, if the market is in a downtrend structure and traders perceive short positions as lower risk, they should use the RTM approach to locate resistance levels, wait for the formation of an engulfing candle (which must cover at least one or two preceding candles), and then initiate sell trades.
Additionally, if the engulfing candle decisively breaks one of the two support or resistance levels in a downtrend, it can be concluded that a new structure has formed in the market, potentially signaling a continuation of the downward trend.
As mentioned in the bullish engulfing pattern, full confirmation of this candle is crucial. You must wait until the candle closes completely in the specified timeframe. There’s a possibility that in the final seconds, the candle may close weakly or with a long wick, which could indicate uncertainty in the direction of the trend.
engulf fake defeat in RTM
In supply and demand zones, we often observe significant price reactions that result in the formation of engulfing candlesticks. However, it’s important to remember that no trading strategy in financial markets is 100% accurate, and errors can occur. Therefore, the possibility of a fake breakout also exists.
Suppose the price breaks through a supply or demand level in RTM (Read The Market) and forms an engulfing candlestick, but immediately afterward, a reverse engulfing candlestick appears. In this scenario, we can say a fake breakout has occurred. Generally, the candles following the engulfing pattern are also crucial for traders. If these candles continue in the same direction as the initial engulfing candle and form with sufficient strength, we can be more confident that no fake breakout has occurred. However, if small or reversal candles appear immediately after the engulfing pattern, there is a higher probability of a fake breakout.
The cause of the formation of engulfs in RTM
A common question is: Why does an engulfing candlestick form? The answer lies in one of the most critical reasons—a surge of liquidity in the direction of the market’s primary structure. This liquidity influx occurs when buyers or sellers enter the market aggressively. Typically, at key levels, traders place a large number of pending orders. When price reaches these levels, these orders are triggered, resulting in the formation of an engulfing candlestick in RTM (Read The Market).
Conclusion
The article examines engulfing candles, which typically exhibit strong market influence and possess a distinct visual appearance compared to other candlesticks. These patterns gain higher validity for traders when identified at significant market levels using the RTM (Read The Market) methodology.
We also emphasized that assessing an engulfing candle’s reliability requires analyzing preceding candles for signs of weakness. Engulfing patterns formed impulsively (e.g., during emotional market reactions) often lack credibility and may quickly invalidate—a common occurrence around economic news releases.