What is Flag Limit (FL)?
Flag Limit (FL), abbreviated as FL, is one of the most widely used concepts in technical analysis, particularly in the RTM (Read The Market) style. This concept helps traders identify potential price reversal points in the market. The Flag Limit acts as a support or resistance level and can be identified based on price action and various chart patterns. But the question is: How can traders use this concept to improve their trading strategies?
In this article, we will explore the Flag Limit concept, how to identify it on charts, and how to apply it in both bullish and bearish markets. Stay tuned with Roshan Trade to dive deeper into this concept and learn how you can effectively use Flag Limit (FL) in your technical analysis.
Introducing the concept of flag limit in RTM style
The RTM (Read The Market) trading strategy is a price-action-based approach that focuses on mean reversion—where price tends to return to its average movement. In this method, key levels such as the Flag Limit (FL) are recognized as critical turning points in the market.
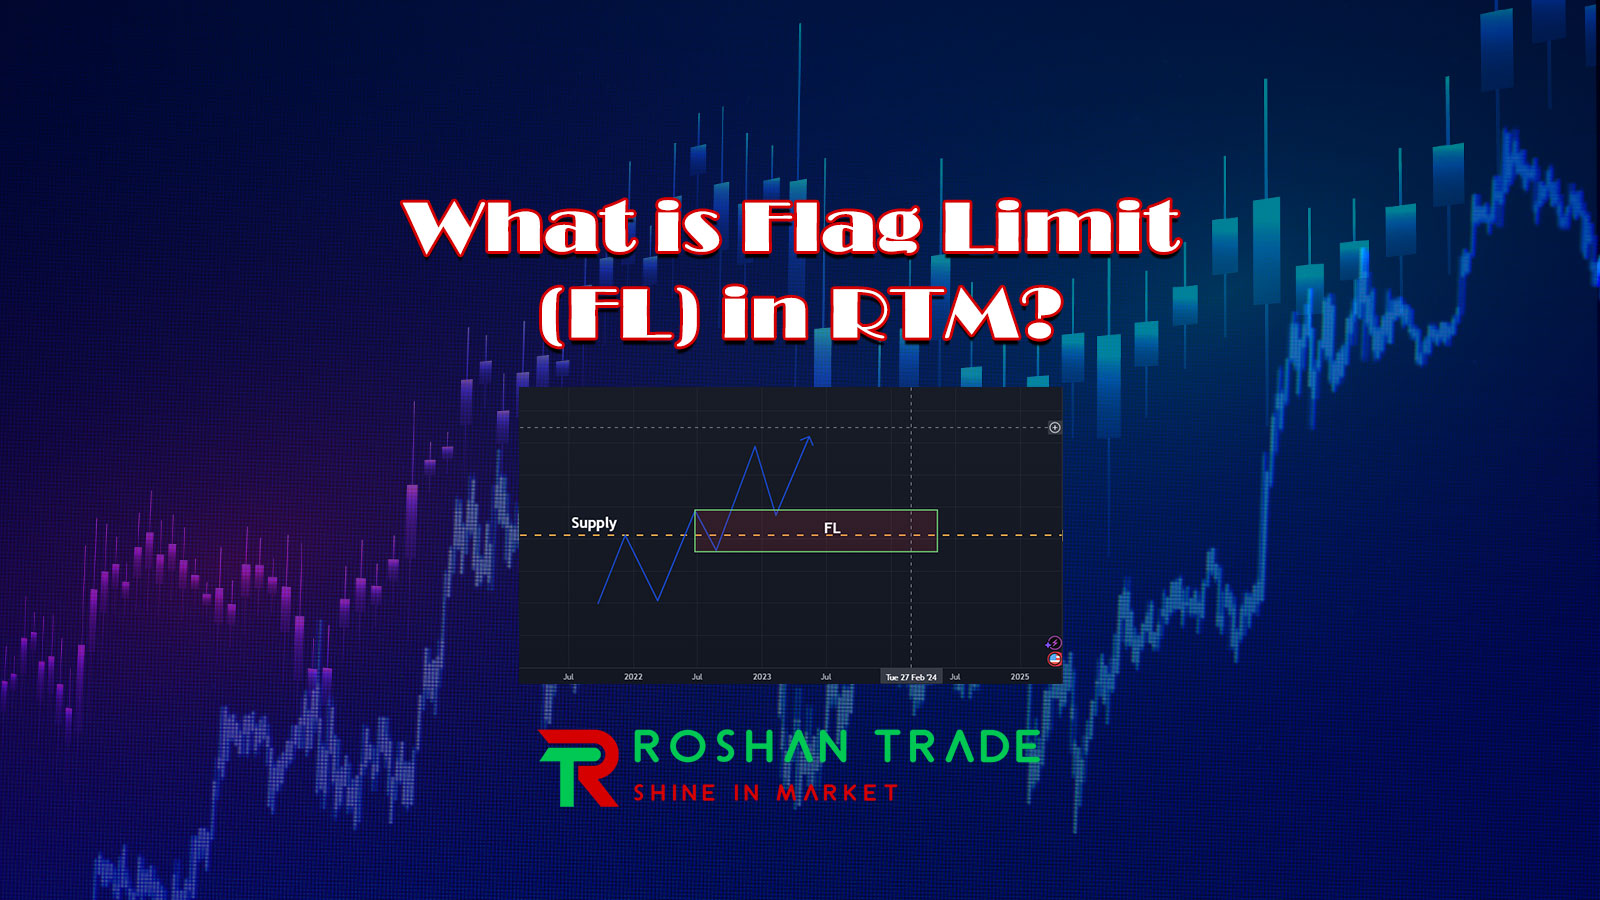
The Flag Limit (FL) is a level that forms after a strong price movement on the chart, indicating a potential reversal zone. In RTM trading, traders look for these key levels where price is likely to reverse, and the Flag Limit serves as one of the most important tools for identifying these points.
These levels typically appear in strong market trends and play a crucial role in determining optimal entry and exit points.
How to identify a limit flag on a chart
Identifying Flag Limits on charts requires sufficient experience and knowledge in technical analysis. One way to detect this level is by observing price behavior near previous key levels. When the price approaches a critical level, such as a Flag Limit, and changes in trading volume or price patterns occur, a price reversal becomes likely.
Traders often use tools like trendlines, moving averages, and price patterns to identify Flag Limits. Additionally, technical indicators such as the RSI or MACD can help improve the accuracy of detecting these levels.
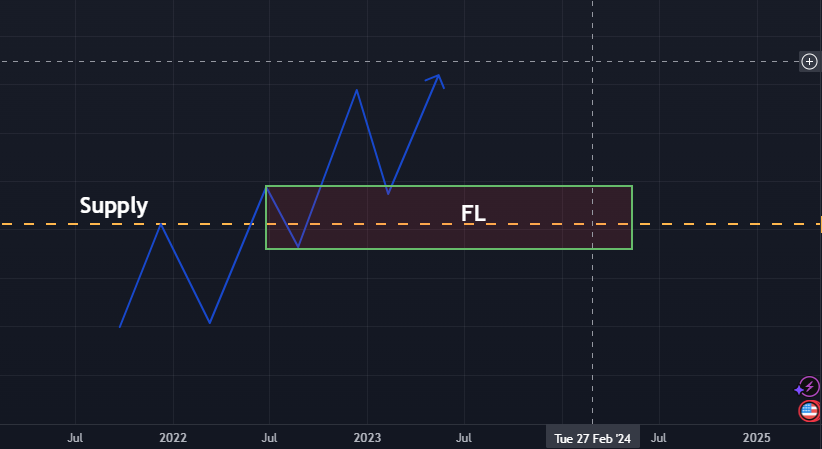
However, the most fundamental method for recognizing this pattern is identifying Support/Resistance (SR) levels from past data and locating Base candles in the same zone.
The role of flag limits in changing market trends
The Flag Limit plays a critical role in determining market trend reversals. When the price reaches the Flag level, it can act as either support or resistance, potentially triggering a price reversal.
- If the price breaks through this level, the current trend is likely to continue.
- If the price rejects the level and reverses, a trend reversal becomes probable. In this case, we call it a FL Flip (Flag Limit Flip).
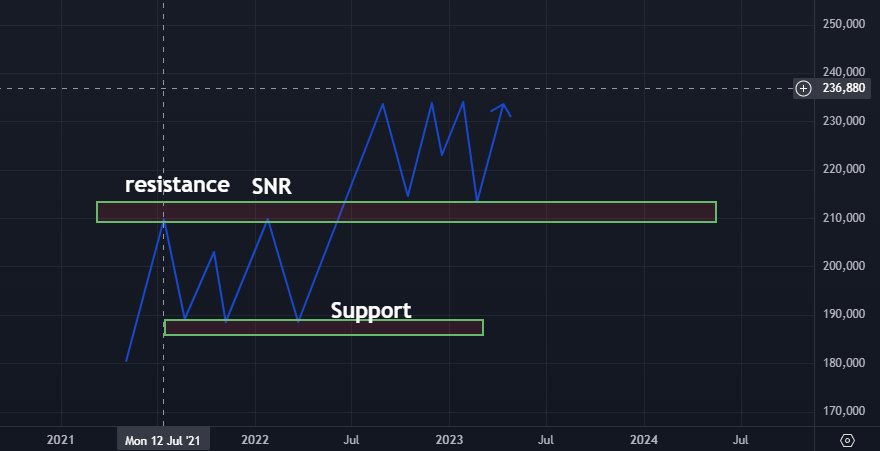
FL as support and resistance level
This pattern is commonly recognized as a support or resistance level.
- As a support level, the Flag Limit can prevent further price declines and act as a reversal point for upward price movement.
- Conversely, as a resistance level, the Flag Limit may halt further price advances and trigger a downward reversal.
How does Flag Limit work in bullish and bearish markets?
This pattern behaves differently in bullish and bearish markets:
- In bullish markets, the Flag Limit typically acts as a resistance level, providing traders with an optimal exit point.
- In bearish markets, the Flag Limit serves as a support level, helping traders identify potential reversal points.
The difference between Flag Limit and other support and resistance levels
Flag Limit (FL) and support/resistance levels are both key tools in technical analysis, but they have important differences. Understanding these distinctions can help traders use both tools effectively.
1. Origin and Definition:
- Support and resistance levels typically refer to price points where the market has historically reacted. Support is a level where the price stops falling and reverses upward, while resistance is a level where the price halts its rise and reverses downward.
- In contrast, a flag limit refers to levels that form after a strong price movement, often serving as a retracement point. These levels are commonly observed during strong market trends and can act as a continuation point for the trend.
2. Identification Method:
- Support and resistance levels are identified primarily through historical price charts. Traders look for points where the price has previously reacted, often based on past highs and lows.
- A flag limit is detected in active trend analysis and is based on specific price patterns. It marks levels where the price retraces after a rapid upward or downward move, typically forming during patterns like flags or price channels.
3. Market Behavior:
- Support and resistance levels are generally seen as reversal points—when the price reaches these levels, a reversal is likely.
- A flag limit plays a critical role when the market is continuing a clear trend. For example, in an uptrend, the flag limit may act as a level where the price retraces after a brief consolidation before resuming its upward movement.
4. Use in Trading Strategies:
- Support and resistance levels are widely used across various trading strategies. Traders often enter or exit positions near these levels.
- A flag limit is more commonly used in trend-following strategies, particularly when traders aim to identify entry or exit points during strong trends.
Conclusion
Ultimately, the Flag Limit serves as a key tool in technical analysis, helping traders identify critical market levels and make better trading decisions. This tool is especially useful in RTM (Read The Market) strategies and trend analysis.
By combining the Flag Limit with other technical tools, you can enhance your trades and minimize potential risks. Moreover, you can integrate the Flag Limit into a structured strategy to maximize its effectiveness in your trading approach.