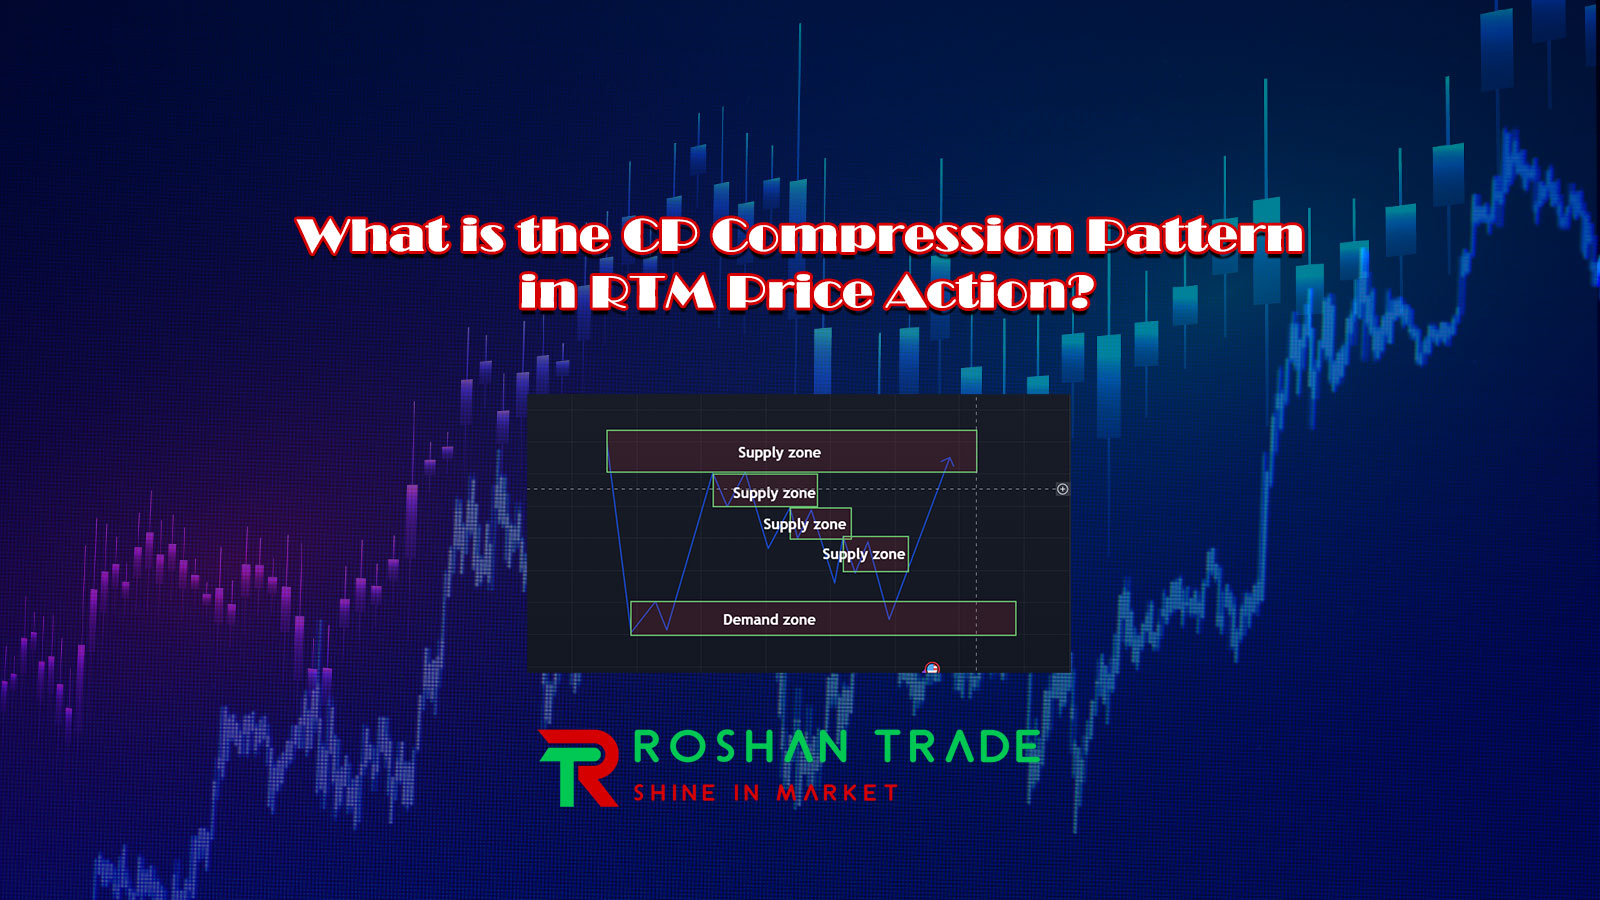
The CP (Compression) pattern in RTM (Read The Market) price action is a trend-reversal pattern, indicating that the market trend is likely to reverse in the near future. If you observe the CP pattern closely, you’ll notice that it resembles a parabolic wedge pattern.
The CP pattern is one of the reversal patterns in RTM. “CP” stands for Compression, where price starts its movement from a demand or supply zone and creates consecutive supply or demand zones along its path. These zones are tested, and the buy or sell orders are filled by traders. This process weakens the trend, and upon reaching a key supply or demand level, a trend reversal occurs.
In the following sections, we will explain how to identify the CP pattern and how to trade it effectively.
Demand Compression Pattern in RTM Price Action
To form a Demand Compression (CP) pattern in RTM (Read The Market) price action, first, a strong demand zone must be established in the market. Price then rises, creates a supply zone, and retraces back to the demand zone. Since the zone has already been tested once, we refer to it as an FTB (First Test Break).
Next, price moves upward again. During its ascent, it forms consecutive demand zones (as shown in the diagram below), and these zones are tested. Each test weakens the buyers’ strength, gradually reducing the momentum of the trend.
Finally, when price reaches a valid supply zone, a trend reversal occurs, and the market reverses downward—often returning to the original demand zone where the movement initially began.
These repeated demand zones cause buy orders to be executed, but over time, sellers gain dominance over buyers, pushing price downward.
Thus, upon reaching the supply zone, price reacts, reverses direction, and retraces back toward the demand zone.
Supply Compression Pattern in RTM Price Action
To form a Supply Compression (CP) pattern in RTM (Read The Market) price action, first, a strong supply zone must be established in the market. Price then declines, creates a demand zone, and retraces back to the supply zone. Since the zone has already been tested once, we refer to it as an FTB (First Test Break).
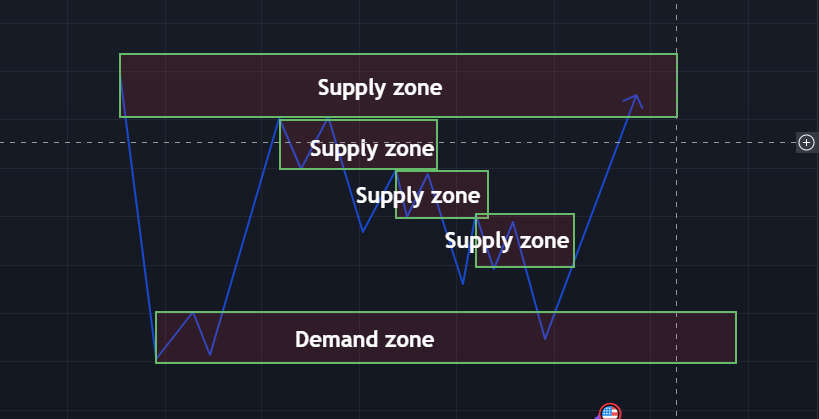
Finally, when price reaches a valid demand zone, a trend reversal occurs, and the market reverses upward – often returning to the original supply zone where the movement initially began.
These repeated supply zones cause sell orders to be executed, but over time, buyers gain dominance over sellers, pushing price upward.
CP pattern recognition methods
- Visually and zigzag price movement with a high slope
- Observing high base candles in the price movement path
- Drawing zones and checking their testing
Identifying the CP pattern with zigzag price movement
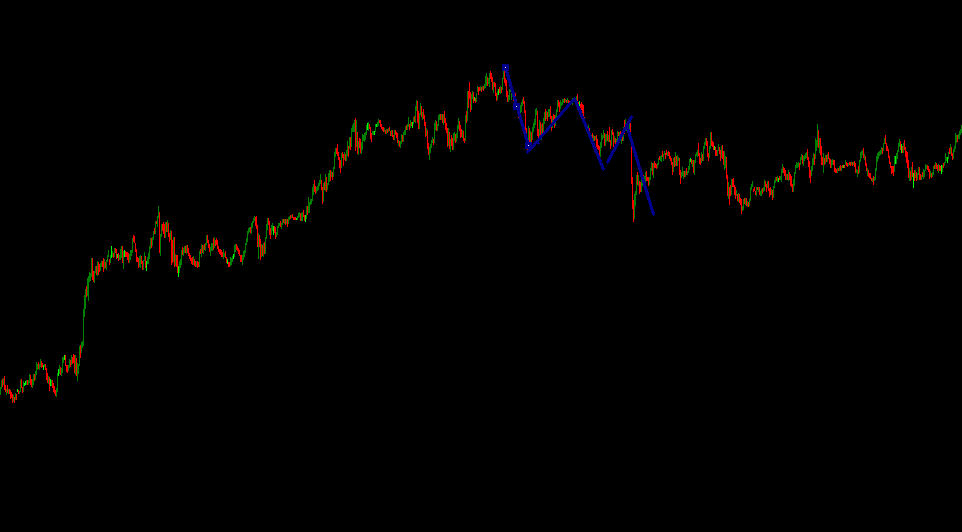
One of the easiest ways to recognize the CP pattern is by eye. That is, if you see the price moving with a steep slope and in a zigzag pattern after a supply or demand area, it means we have a compression pattern and you can enter the trade by observing other patterns or reaching a valid zone.
A large number of base candles in the CP pattern
The second way to recognize the CP pattern, or compression, is to observe a large number of base candles on the chart. In the figure below, the price has fallen after the FTB and moved downwards in a Sharpe pattern, and there are many base candles along the way, which we have marked on them.
Drawing zones and checking their testing
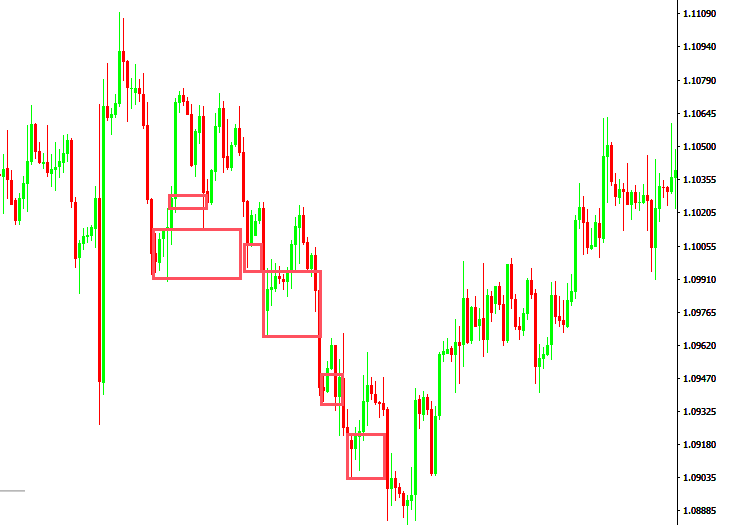
This method is more reliable than the previous two methods and it can be said with more certainty that the CP pattern is present in the chart.
In the figure below, the price is falling in a Sharpe pattern with an angle of more than 45 degrees. Along this path, several demand areas have been created and all of them have been tested. So, we can say that there is a compression pattern in the price action.
Conclusion
The CP (Compression) pattern is one of the reversal patterns in RTM (Read The Market) methodology. Compared to other RTM patterns like Flag Limit, FTR, Caps, etc., this pattern has lower reliability, and traders should not enter trades based solely on this pattern.
In reality, the CP pattern is primarily used to confirm trend reversals. When observed alongside other patterns, it serves as additional confirmation for a trader’s decision.
This pattern begins from either a supply or demand zone and makes a sharp move toward another valid zone. During this movement, multiple zones are created, and these zones get tested.
The testing of these zones indicates that orders are being filled and the trend’s strength is weakening. This suggests that the market is likely to reverse its trend in the near future.